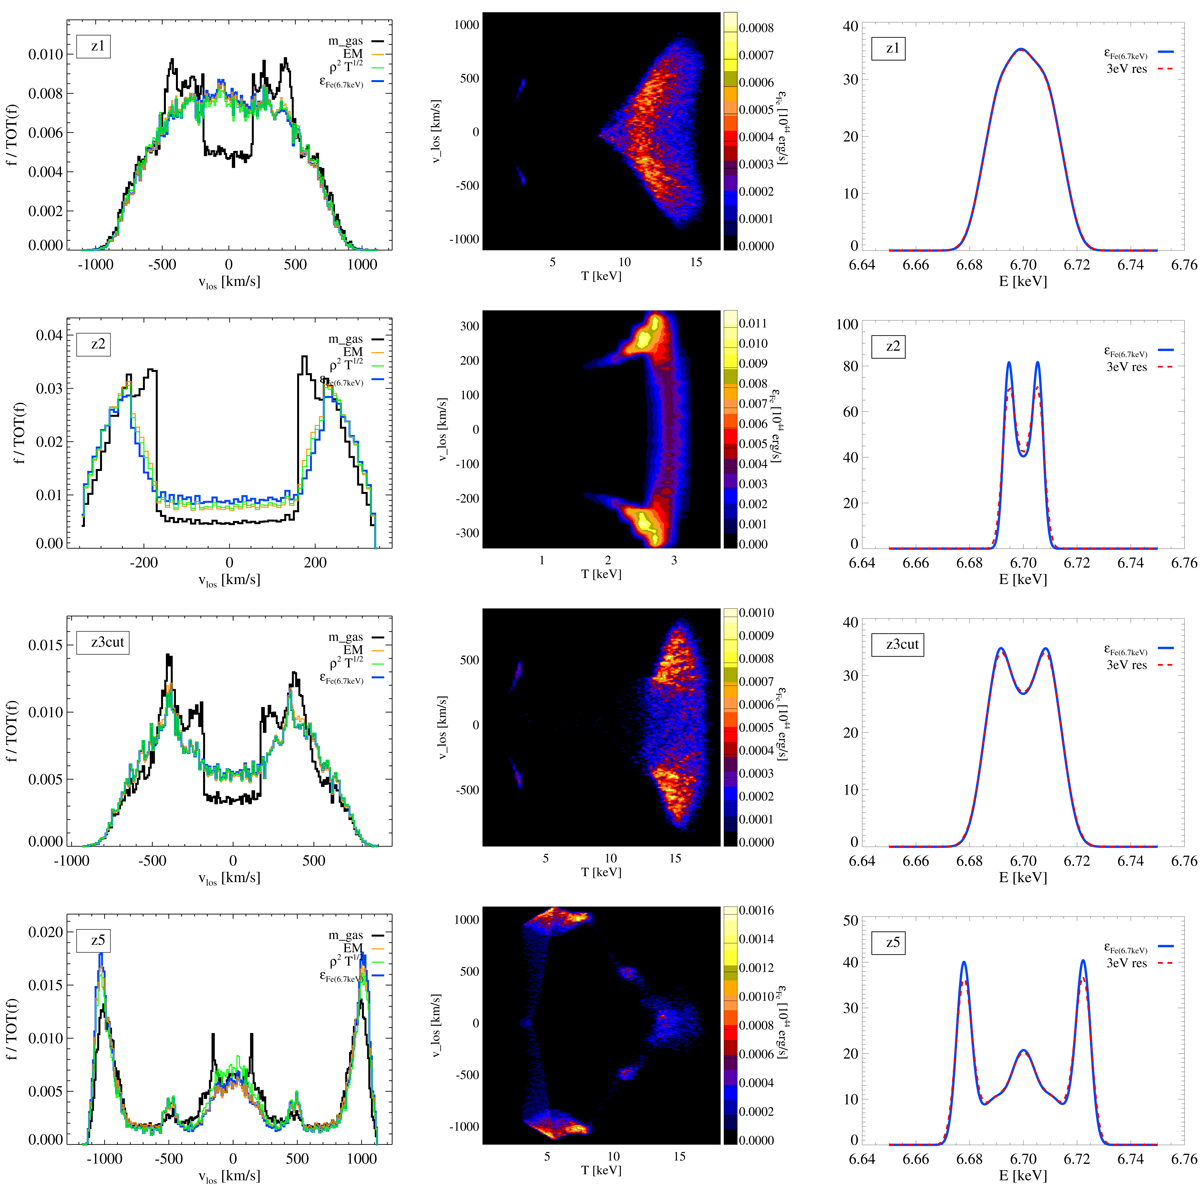
Fig. 2.
Download original image
Velocity features of the ICM selected within the z1, z2, z3cut and z5 regions. Left panels: velocity distributions, in terms of fractional contribution of the gas in each velocity bin to the total in the selected region, considering different gas properties f: gas mass (black), EM (orange), Bremsstrahlung-like emissivity (green) or Fe emissivity (blue). Middle panels: velocity-temperature diagrams, color coded by Fe emissivity. Here, the iron emissivity is computed assuming an APEC model for the 6.5−7.1 keV rest-frame energy band comprising the Fe He-like Kα complex. Right panels: theoretical shape of an idealized Fe He-like line centered at 6.7 keV, after the convolution with the gas velocity distribution (blue solid lines), and with an additional smoothing for a representative 3 eV energy resolution (red dashed lines). The flux reported on the y-axis is in arbitrary units.
Current usage metrics show cumulative count of Article Views (full-text article views including HTML views, PDF and ePub downloads, according to the available data) and Abstracts Views on Vision4Press platform.
Data correspond to usage on the plateform after 2015. The current usage metrics is available 48-96 hours after online publication and is updated daily on week days.
Initial download of the metrics may take a while.