Fig. 14.
Download original image
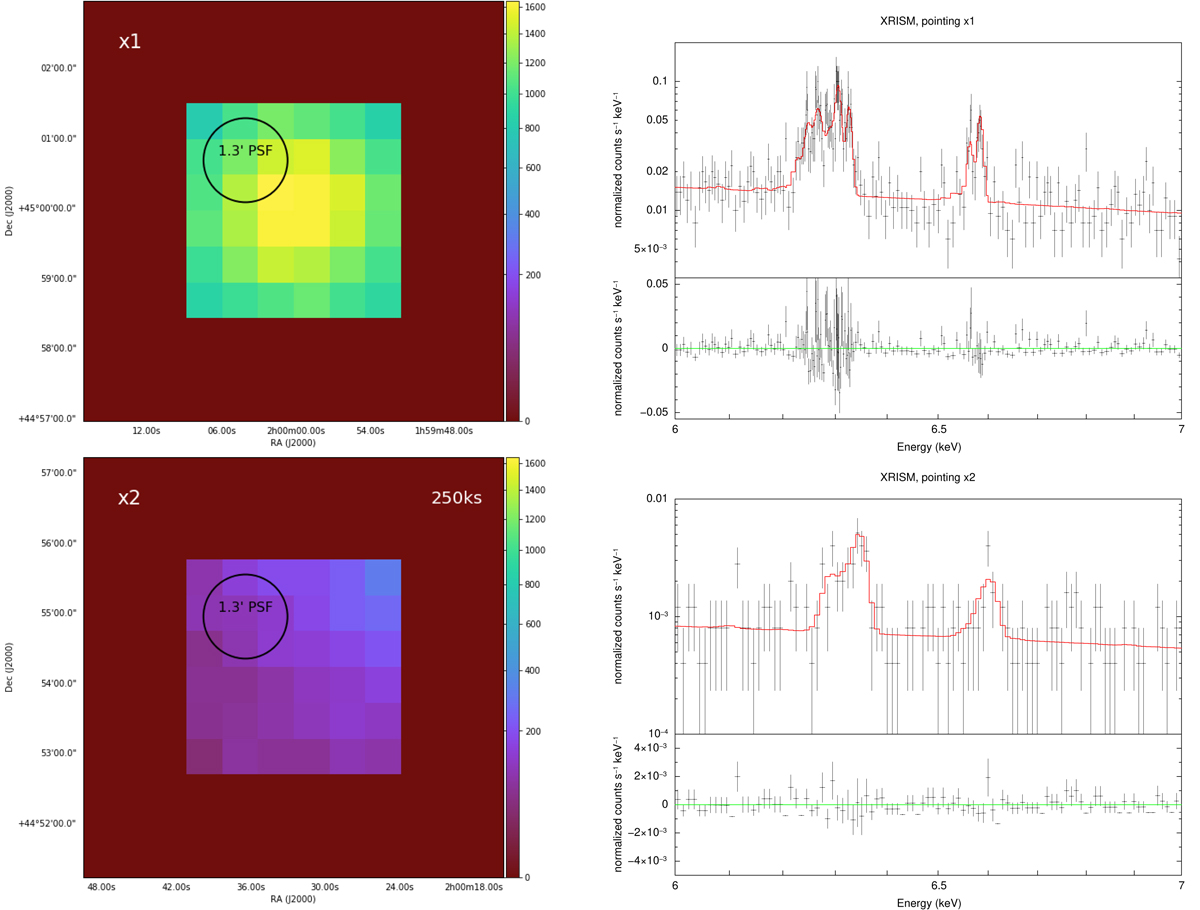
Left: XRISM Resolve images (0.5−2 keV band) for the x1 (top) and x2 (bottom) pointings shown in Fig. 13. The images (color coded with the same scale for comparison) refer to observations of 100 ks and 250 ks exposure, for x1 and x2 respectively. The physical size of each pointing is 200 kpc per side and the XRISM Resolve PSF is 1.3′. Right: spectrum, best-fit model and residuals in the 6−7 keV band around the Fe-K line complex, for the XRISM Resolve 100 ks and 250 ks mock observations of the x1 and x2 regions (upper and lower panel, respectively).
Current usage metrics show cumulative count of Article Views (full-text article views including HTML views, PDF and ePub downloads, according to the available data) and Abstracts Views on Vision4Press platform.
Data correspond to usage on the plateform after 2015. The current usage metrics is available 48-96 hours after online publication and is updated daily on week days.
Initial download of the metrics may take a while.