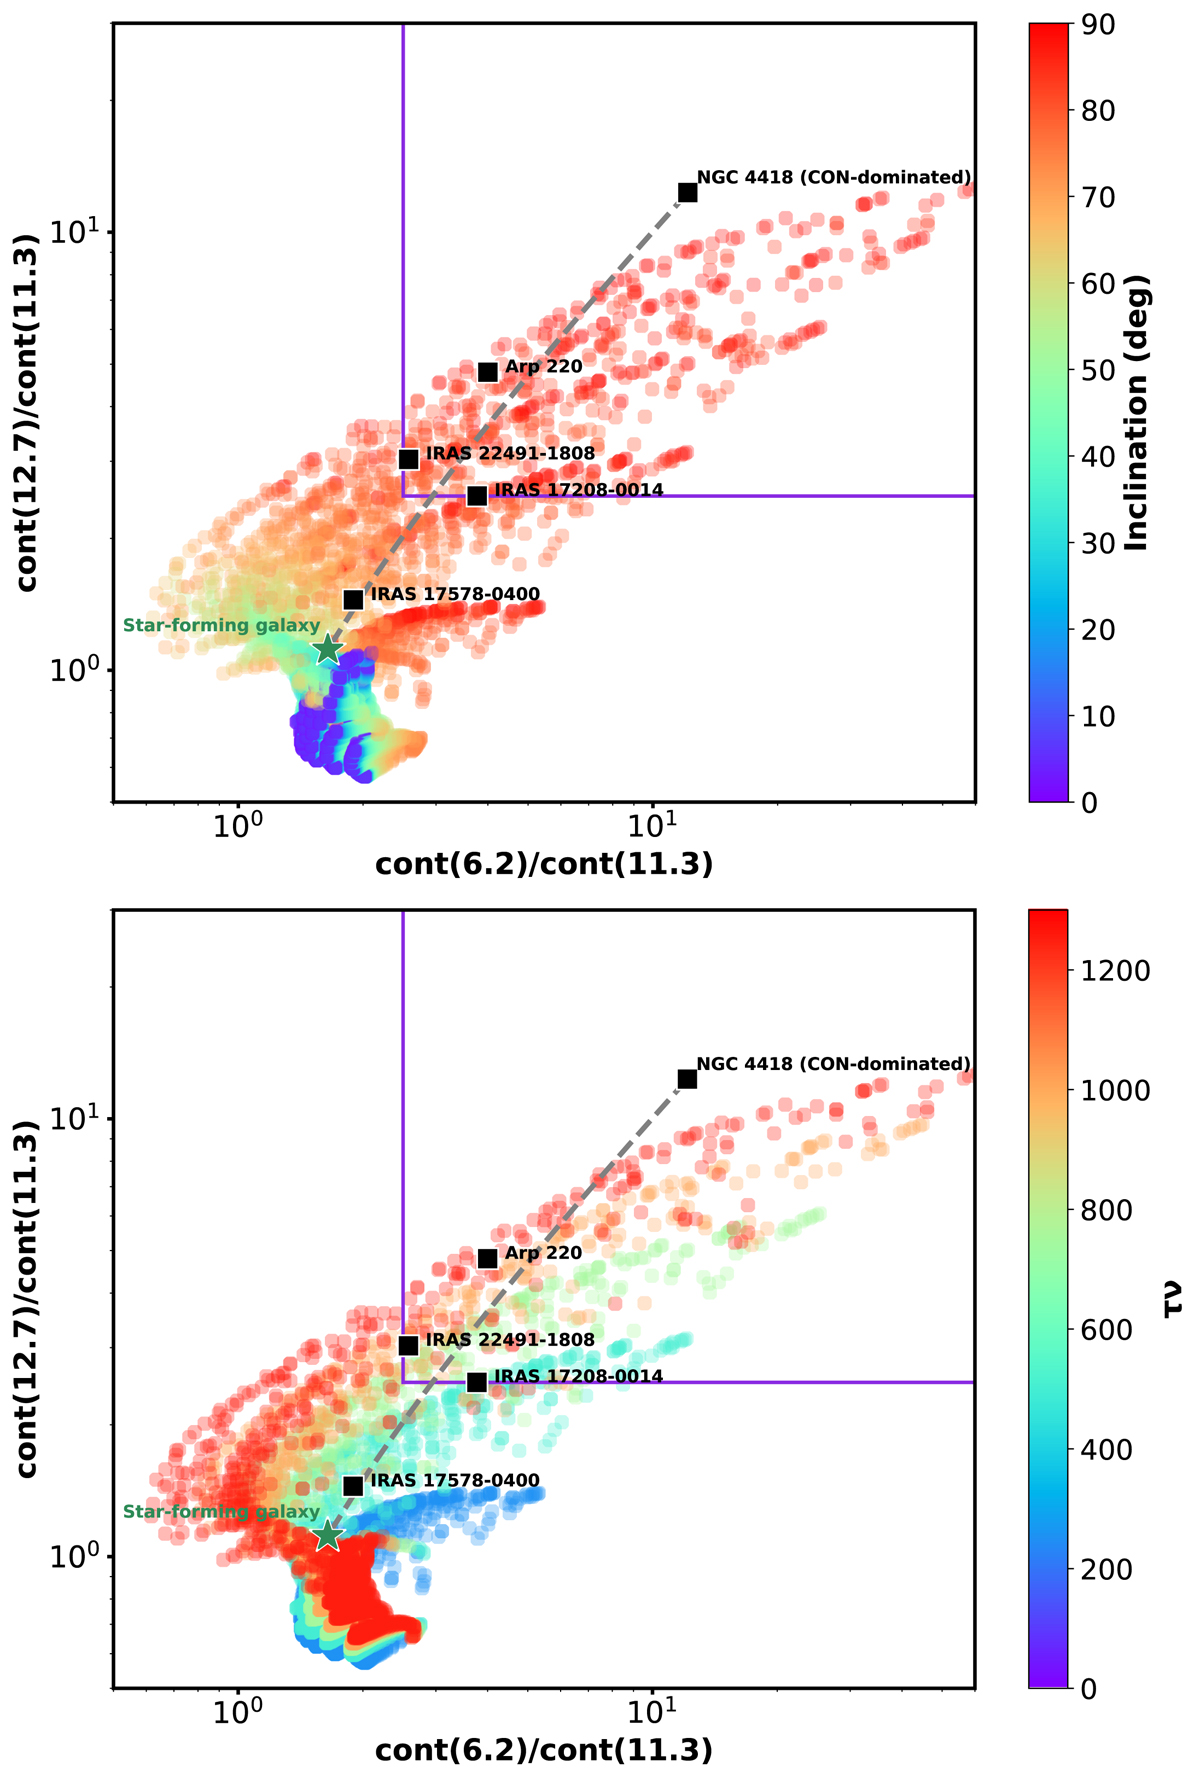
Fig. 9.
Download original image
Comparison of the observed continuum ratios seen in CONs (12.7/11.3 μm vs. 6.2/11.3 μm) to those computed from the smooth CYGNUS models by Efstathiou & Rowan-Robinson (1995) and Efstathiou et al. (2021). The black squares correspond to the observed values of the CONs. The green star represents a normal star-forming galaxy. Colour-coded circle symbols represent the torus inclination angle and equatorial optical depth (τ1000 Å) in the top and bottom panels, respectively. The purple square denotes the region where CON-dominated sources are located and defined by the continuum flux ratios: cont(11.3 μm)/cont(6.2 μm) > 2.5 and cont(11.3 μm)/cont(12.7 μm) > 2.5. The dashed grey line corresponds to a track of simulated spectra for galaxies containing a CON varying contributions of the host galaxy as presented in Fig. 5.
Current usage metrics show cumulative count of Article Views (full-text article views including HTML views, PDF and ePub downloads, according to the available data) and Abstracts Views on Vision4Press platform.
Data correspond to usage on the plateform after 2015. The current usage metrics is available 48-96 hours after online publication and is updated daily on week days.
Initial download of the metrics may take a while.