Fig. 8.
Download original image
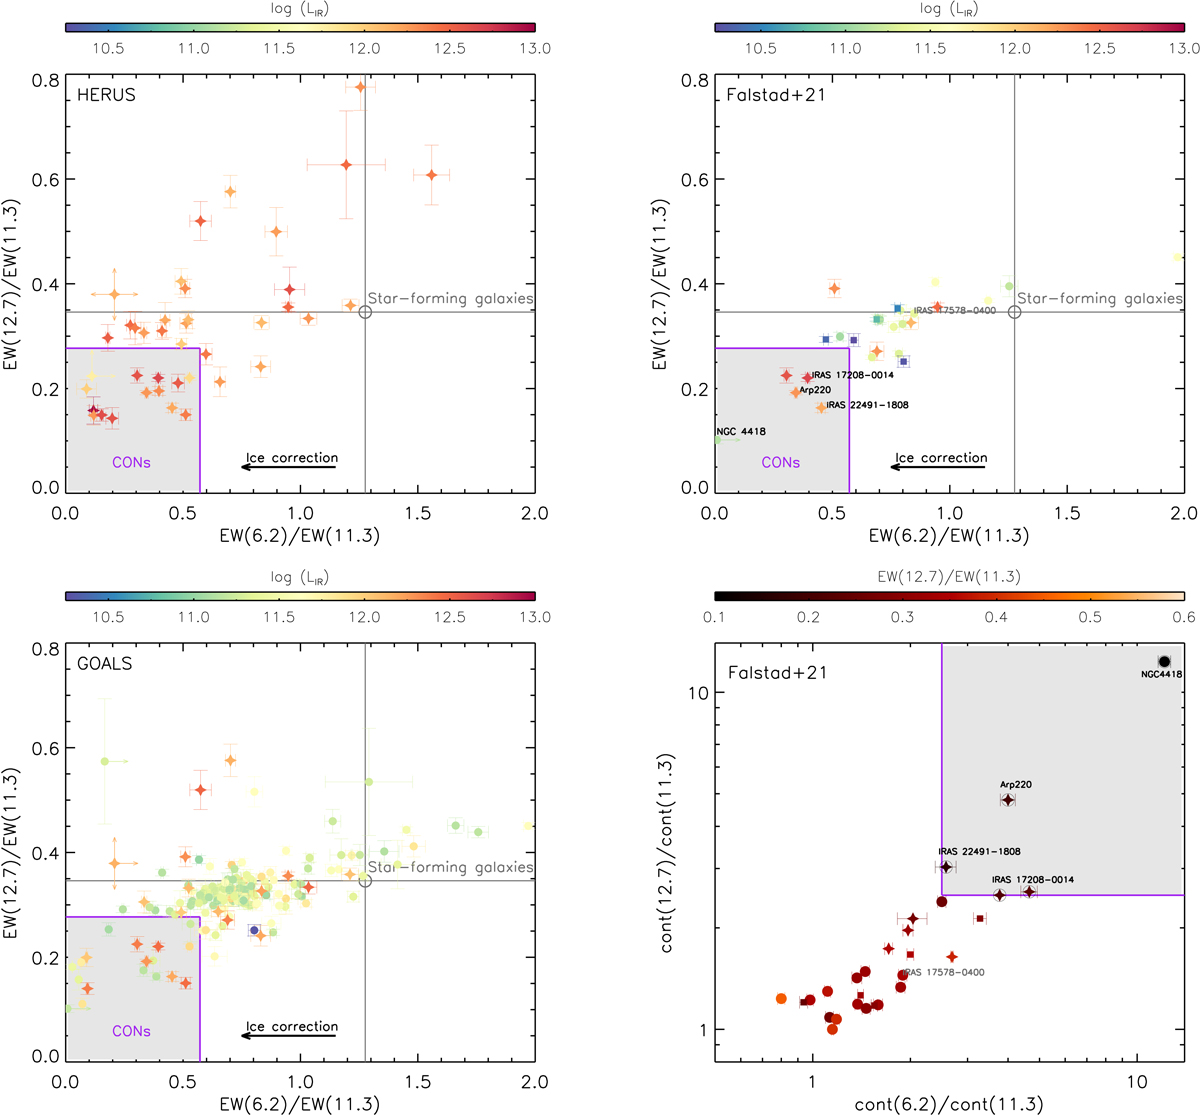
Diagnostic diagrams for identifying heavily obscured nuclei. From top left- to bottom right-hand panels: the HERUS, CON-quest, and GOALS sample. Colour-coded stars, circles, and squares represent the IR luminosity of ULIRGs, LIRGs, and subLIRGs, respectively. The grey solid vertical and horizontal lines correspond to the average values for star-forming galaxies. The black arrows indicate the effect the ice absorption correction has on the 6.2/11.3 μm PAH EW ratio. The purple square denotes the region defined by the PAH EW(6.2 μm)/EW(11.3 μm) < 0.572 and PAH EW(12.7 μm)/EW(11.3 μm) < 0.277 (see text). Bottom right panel: diagnostic diagram based on continuum ratios for the CON-quest sample. The purple square denotes the region defined by the continuum flux ratios: cont(11.3 μm)/cont(6.2 μm) > 2.5 and cont(11.3 μm)/cont(12.7 μm) > 2.5 (see text). Colour-coded stars, circles, and squares represent the 12.7/11.3 μm PAH EW ratio of ULIRGs, LIRGs, and subLIRGs, respectively. Open black circles correspond to sources within the purple square in top right panel. Labelled sources correspond to those galaxies classified as CONs in Falstad et al. (2021).
Current usage metrics show cumulative count of Article Views (full-text article views including HTML views, PDF and ePub downloads, according to the available data) and Abstracts Views on Vision4Press platform.
Data correspond to usage on the plateform after 2015. The current usage metrics is available 48-96 hours after online publication and is updated daily on week days.
Initial download of the metrics may take a while.