Fig. 7.
Download original image
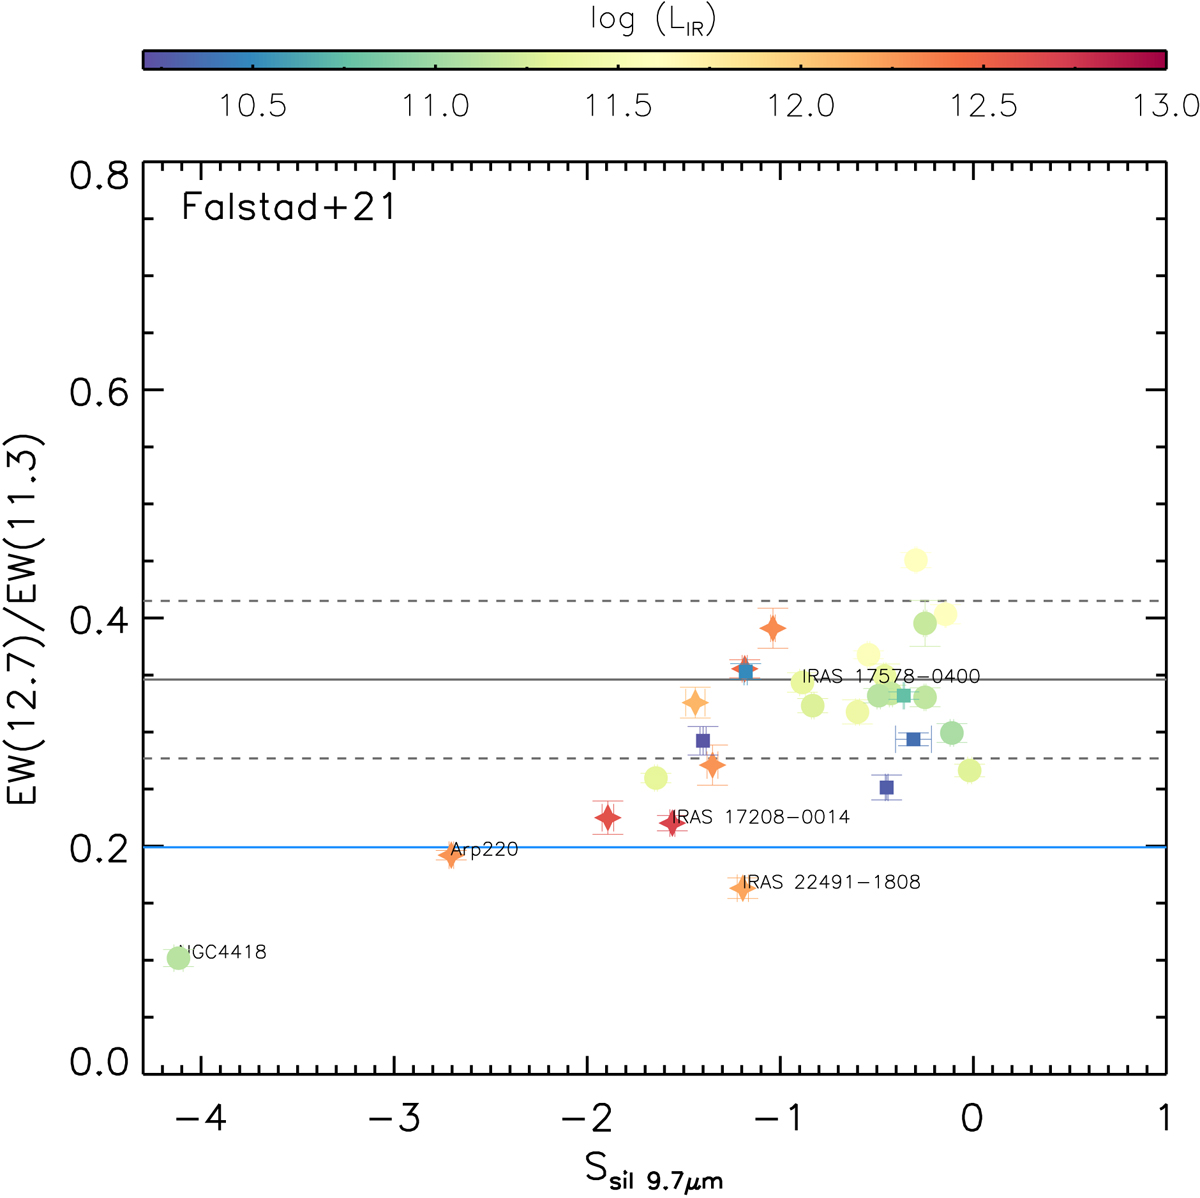
Same as Fig. 2 but for the CON-quest sample. Labelled sources correspond to same galaxies as in Fig. 6 (i.e. those galaxies classified as CONs in Falstad et al. 2021). Colour-coded stars, circles, and squares represent the IR luminosity of ULIRGs, LIRGs, and subLIRGs, respectively. The grey solid and dashed horizontal lines correspond to the average and 3σ values found by Hernán-Caballero et al. (2020) for star-forming galaxies. Blue solid line corresponds to average value found for group 2 of ULIRGs (see text).
Current usage metrics show cumulative count of Article Views (full-text article views including HTML views, PDF and ePub downloads, according to the available data) and Abstracts Views on Vision4Press platform.
Data correspond to usage on the plateform after 2015. The current usage metrics is available 48-96 hours after online publication and is updated daily on week days.
Initial download of the metrics may take a while.