Fig. 6.
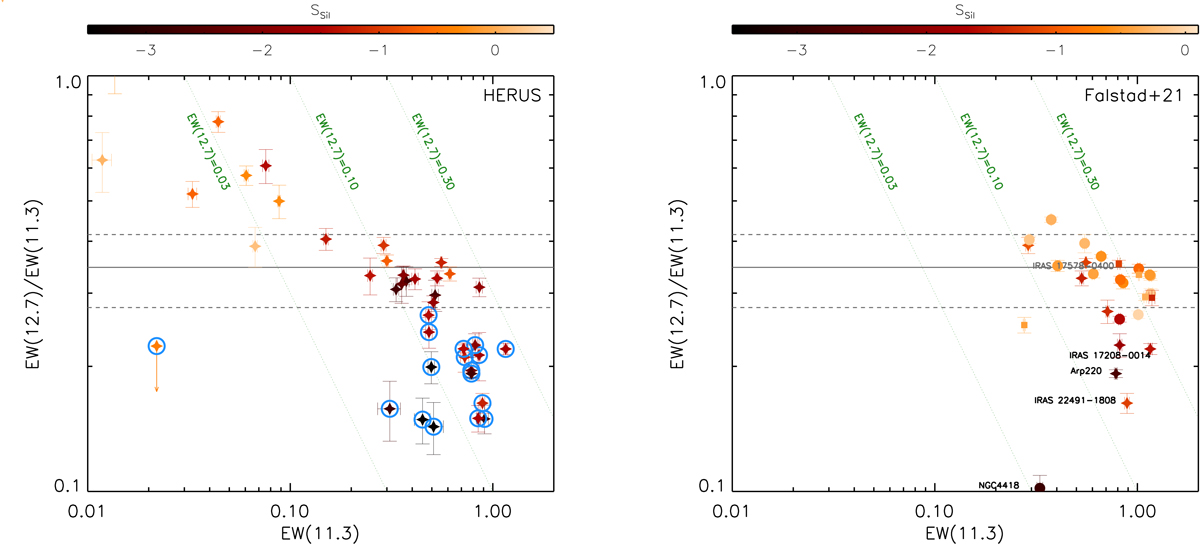
Download original image
12.7/11.3 μm PAH EW ratio versus PAH EW(11.3). Left panel: EW plot for the HERUS sample. Open blue circles correspond to group of 2 ULIRGs. Right panel: EW plot for the CON-quest sample. Labelled sources correspond to those galaxies classified as CONs in Falstad et al. (2021). Colour-coded stars, circles, and squares represent the strength of the 9.7 μm silicate feature of ULIRGs, LIRGs, and subLIRGs, respectively. Colour-coded symbols correspond to the strength of the 9.7 μm silicate feature. The grey solid and dashed horizontal lines correspond to the average and 3σ values found by Hernán-Caballero et al. (2020) for star-forming galaxies. Finally, the green dotted lines represent constant values of the 12.7 μm PAH EW (0.03, 0.10 and 0.30).
Current usage metrics show cumulative count of Article Views (full-text article views including HTML views, PDF and ePub downloads, according to the available data) and Abstracts Views on Vision4Press platform.
Data correspond to usage on the plateform after 2015. The current usage metrics is available 48-96 hours after online publication and is updated daily on week days.
Initial download of the metrics may take a while.