Fig. 5.
Download original image
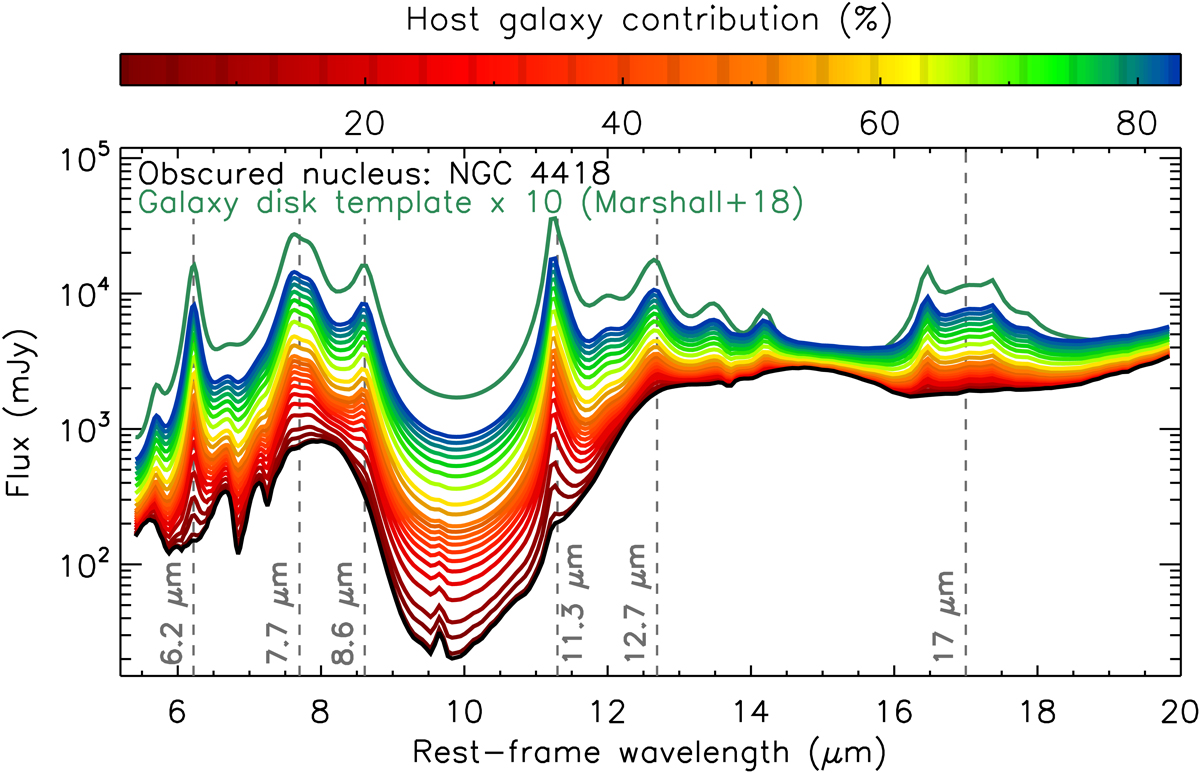
Predicted range of mid-IR spectra of galaxies containing a CON. These spectra are generated using different fractions of the host galaxy (represented by the host galaxy disc template from Marshall et al. 2018; solid green line) superimposed on the Spitzer/IRS spectrum of the archetypical CON-dominated source NGC 4418 (black solid line). The colour-code represents different fractions of the host galaxy. Dark red to blue solid lines correspond to increasing values of the host galaxy contribution with respect to the nuclear source. The grey vertical dashed lines denote the location of the strongest PAH bands (6.2, 7.7, 8.6, 11.3, 12.7 and 17 μm).
Current usage metrics show cumulative count of Article Views (full-text article views including HTML views, PDF and ePub downloads, according to the available data) and Abstracts Views on Vision4Press platform.
Data correspond to usage on the plateform after 2015. The current usage metrics is available 48-96 hours after online publication and is updated daily on week days.
Initial download of the metrics may take a while.