Free Access
Fig. 3.
Download original image
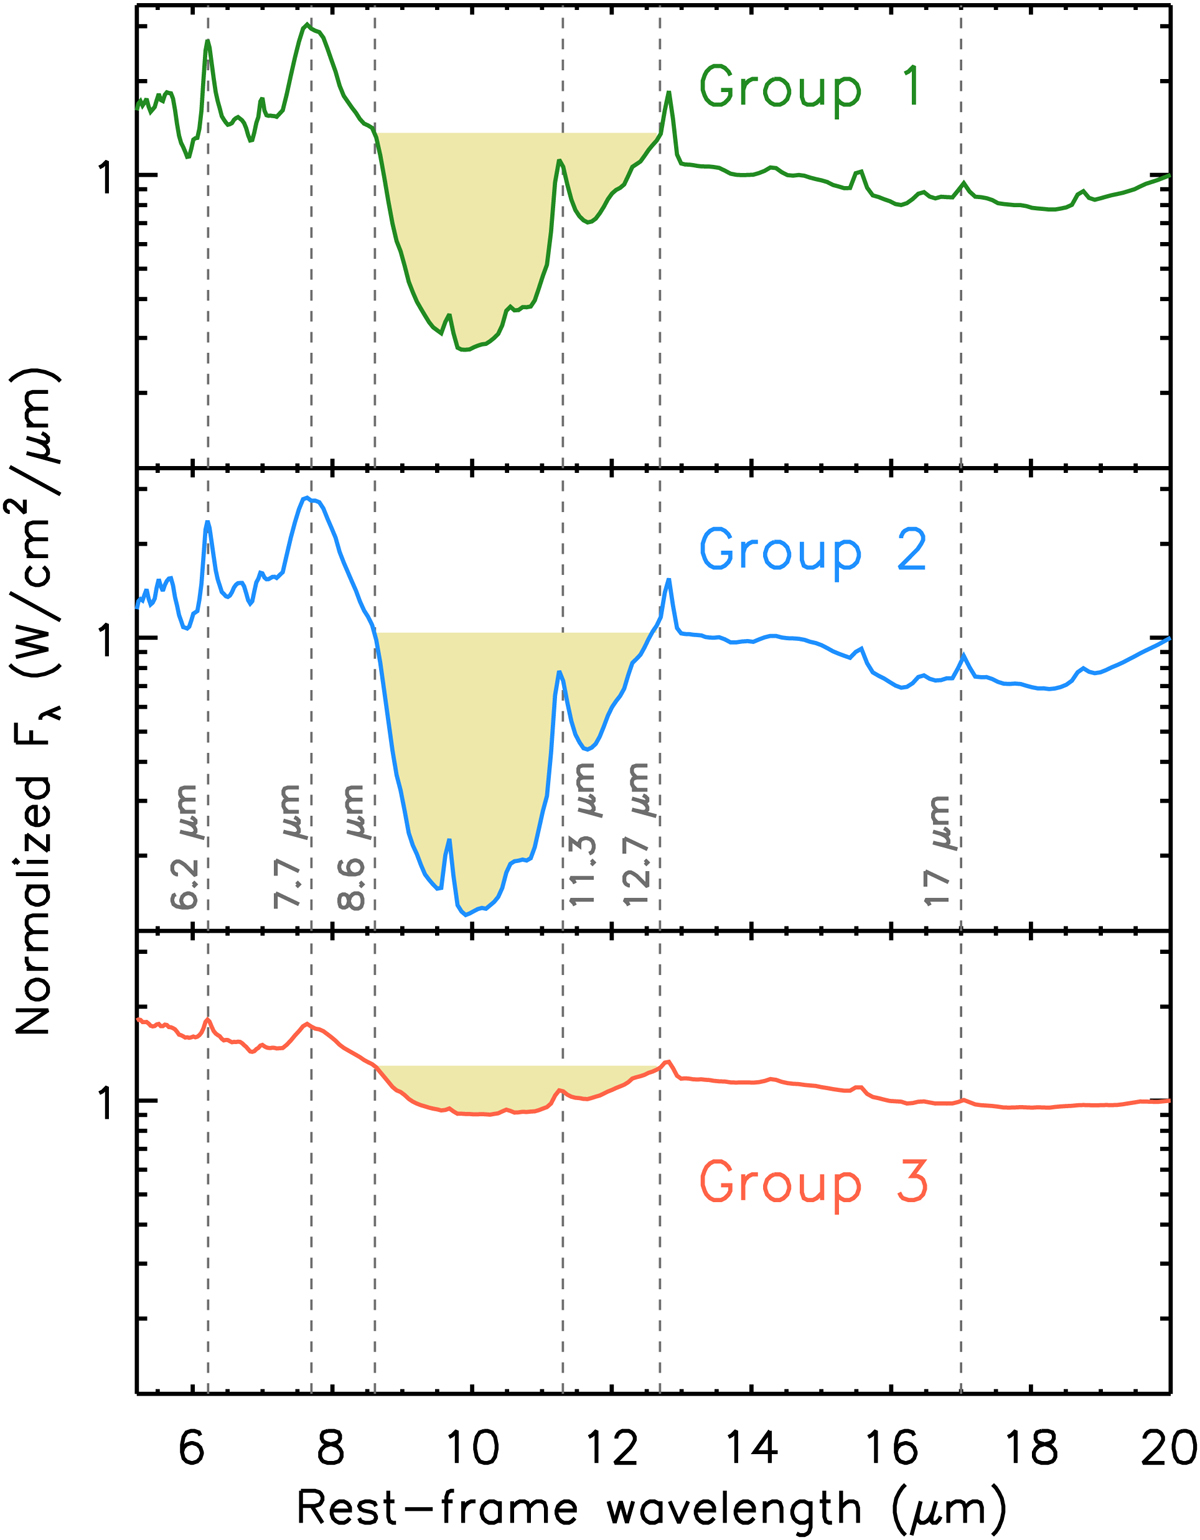
Average spectra (normalized at 20 μm) for the three ULIRG groups defined in Sect. 4.1. The grey vertical dashed lines denote the location of the strongest PAH bands (6.2, 7.7, 8.6, 11.3, 12.7 and 17 μm). The yellow shaded region highlights the different degrees of silicate absorptions for the various ULIRG groups.
Current usage metrics show cumulative count of Article Views (full-text article views including HTML views, PDF and ePub downloads, according to the available data) and Abstracts Views on Vision4Press platform.
Data correspond to usage on the plateform after 2015. The current usage metrics is available 48-96 hours after online publication and is updated daily on week days.
Initial download of the metrics may take a while.