Fig. 2.
Download original image
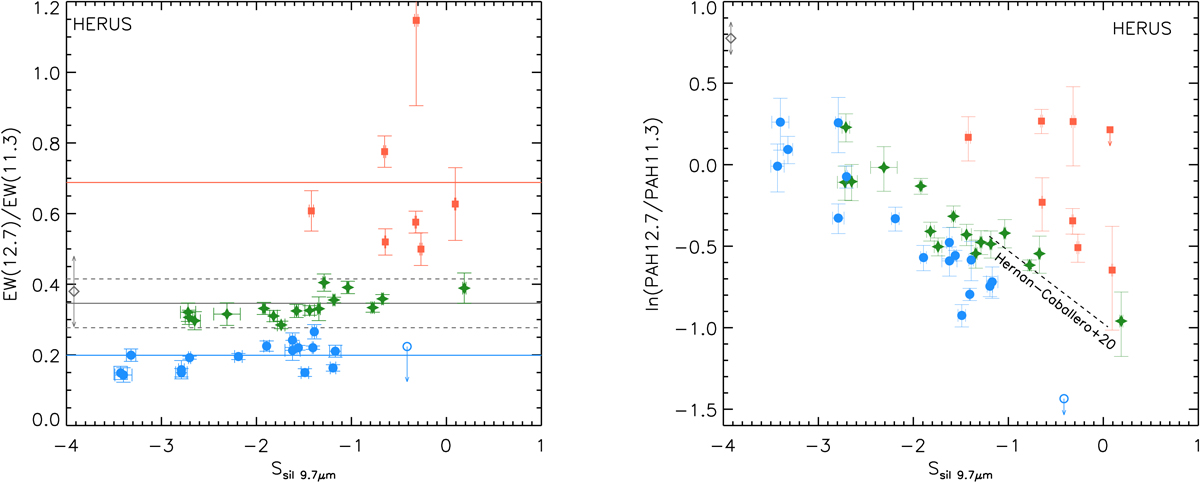
Dependence of the PAH EW and flux ratios with the silicate strength. Left panel: 12.7/11.3 μm PAH EW ratio versus the strength of the 9.7 μm silicate feature for the HERUS sample. The grey solid and dashed horizontal lines correspond to the average and 3σ values found by Hernán-Caballero et al. (2020) for star-forming galaxies. The blue and red solid horizontal lines represent the average values found for groups 2 and 3 of ULIRGs (see text). Right panel: Same as the left panel but using the 12.7/11.3 μm PAH flux ratio instead of the PAH EW ratio. Green stars, blue circles, and red squares correspond to groups 1, 2, and 3 of ULIRGs (see text). The black dashed line represents the correlation result from the fit of star-froming galaxies (Hernán-Caballero et al. 2020). Open blue circles and open grey diamonds correspond to sources with PAH EW upper limits. The silicate strength is computed as SSil = ln(fpeak/fcont) (see Sect. 3).
Current usage metrics show cumulative count of Article Views (full-text article views including HTML views, PDF and ePub downloads, according to the available data) and Abstracts Views on Vision4Press platform.
Data correspond to usage on the plateform after 2015. The current usage metrics is available 48-96 hours after online publication and is updated daily on week days.
Initial download of the metrics may take a while.