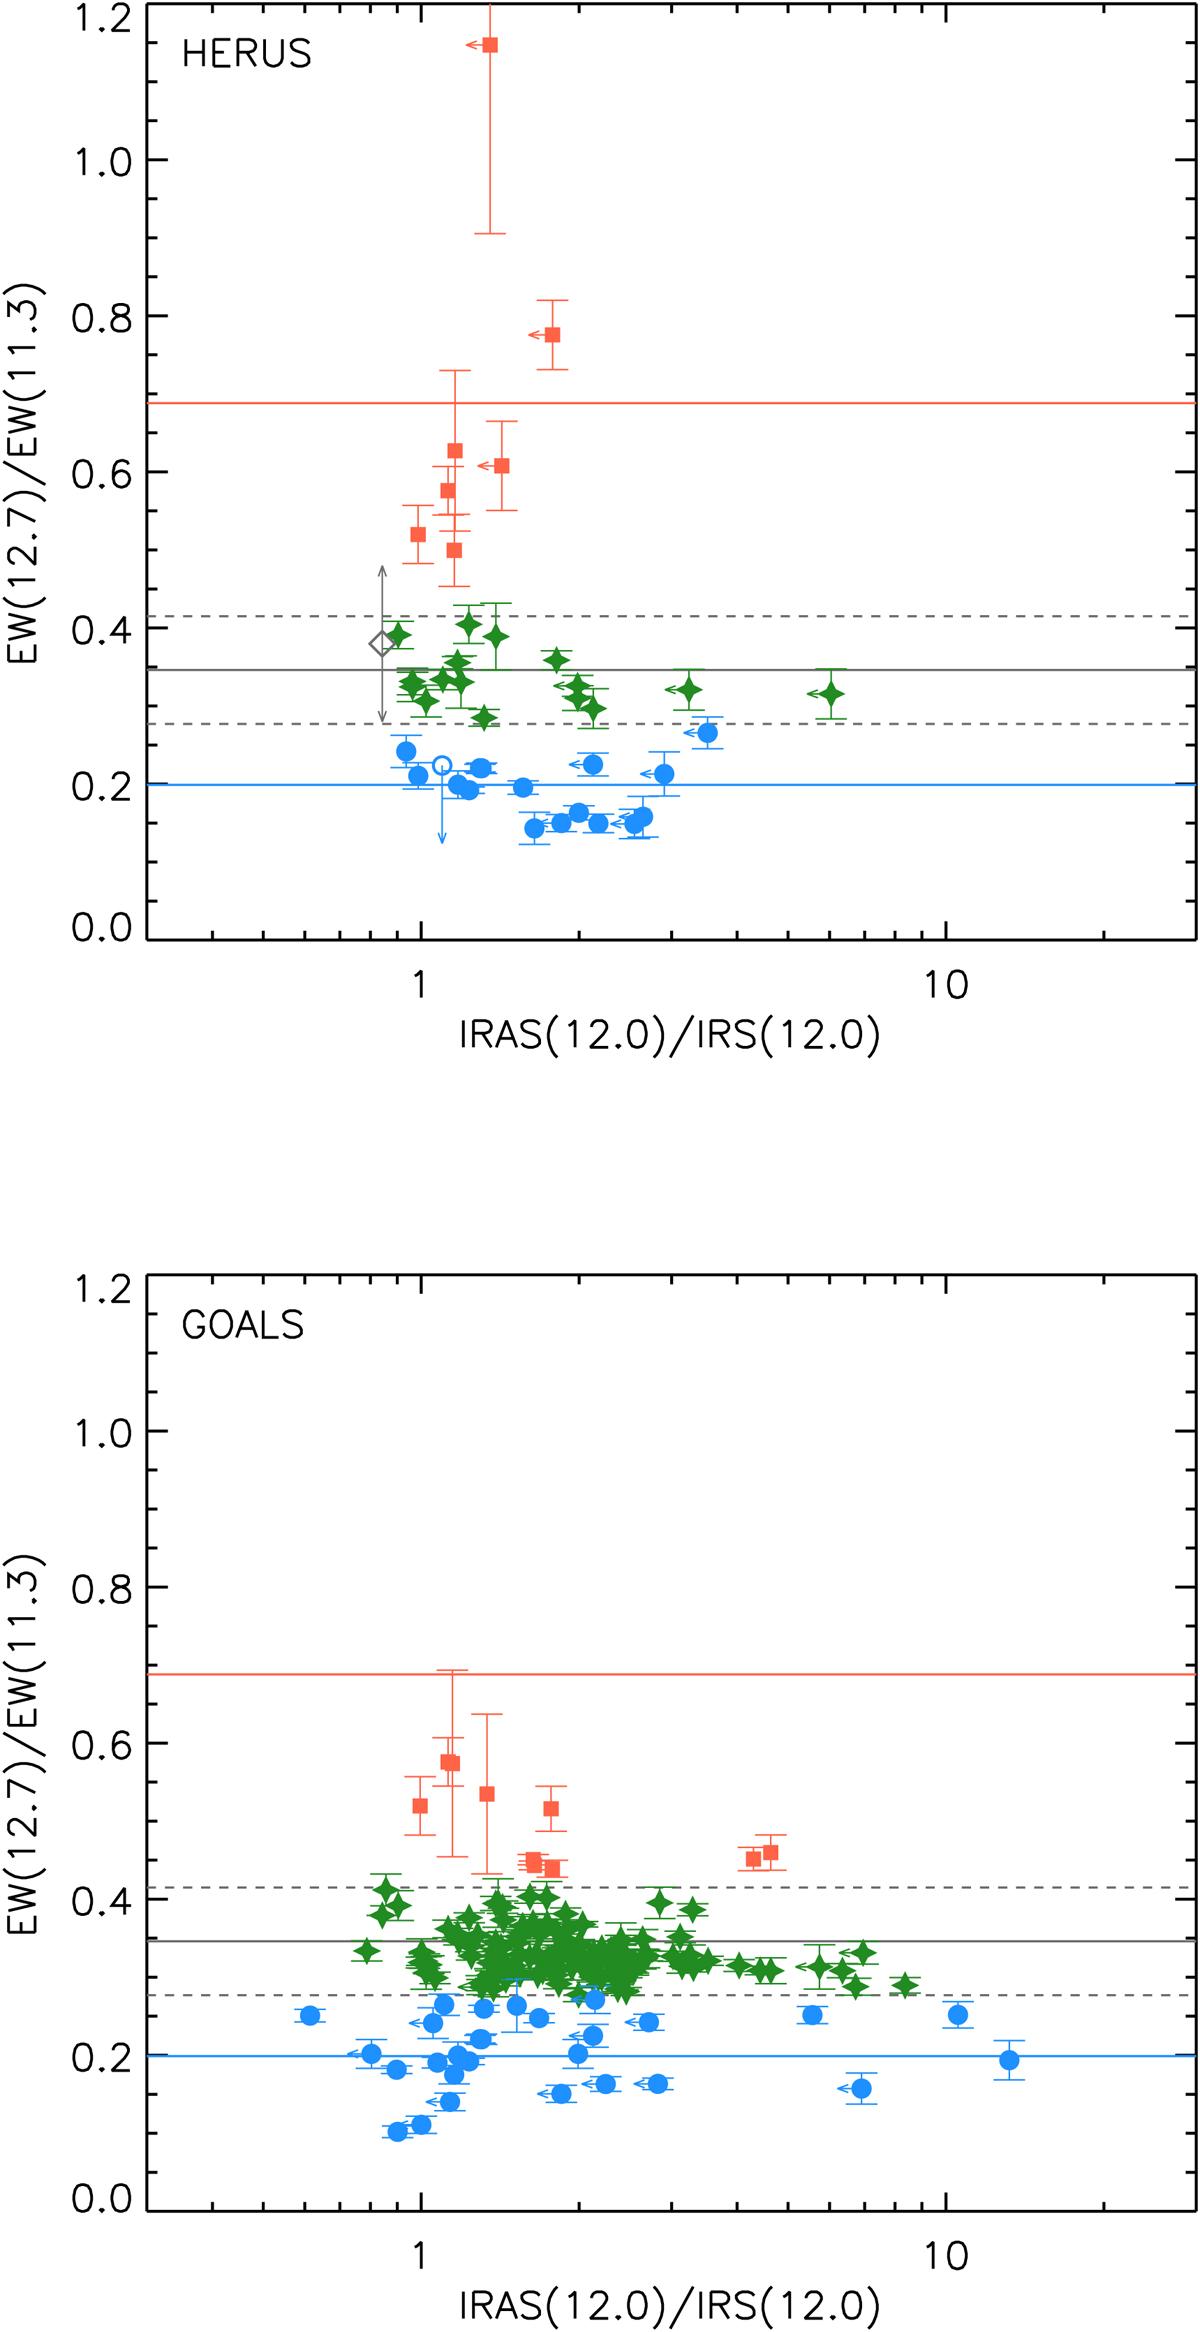
Fig. A.1.
Download original image
Top panel: 12.7/11.3 μm PAH EW ratio vs the IRAS 12 μm/IRS 12 μm flux ratios for the HERUS sample. Green, blue, and red symbols correspond to group 1, 2, and 3 of sources (see Sect. 4.1. Bottom panel: same as the top panel but using the GOALS sample. The grey solid and dashed horizontal lines correspond to the average and 3σ values found by Hernán-Caballero et al. (2020) for star-forming galaxies. The blue and red solid horizontal lines represent the average values found for groups 2 and 3 of ULIRGs (see Sect. 4.1).
Current usage metrics show cumulative count of Article Views (full-text article views including HTML views, PDF and ePub downloads, according to the available data) and Abstracts Views on Vision4Press platform.
Data correspond to usage on the plateform after 2015. The current usage metrics is available 48-96 hours after online publication and is updated daily on week days.
Initial download of the metrics may take a while.