Fig. 10.
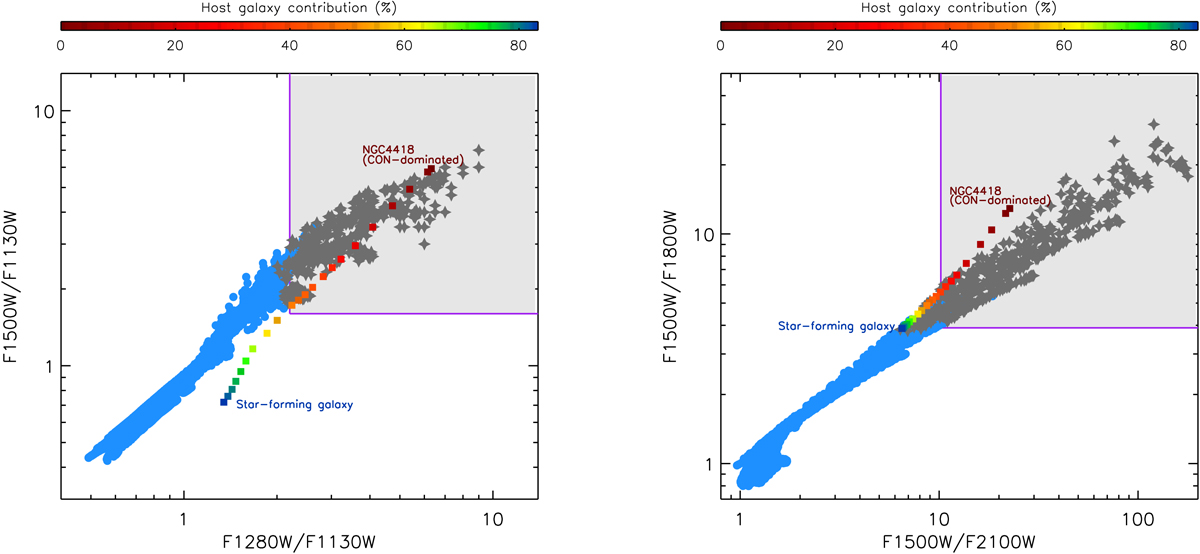
Download original image
Colour–colour diagrams using JWST filters. Left panel: smooth CYGNUS torus model SEDs at z = 0. Right panel: smooth CYGNUS torus model SEDs at z = 1. Blue circles correspond to the broad-band filter ratio for all the SEDs of smooth CYGNUS torus models. Grey stars represent those ratios of the model SEDs of deeply obscured nuclei (classified based on the continuum ratio criteria presented in Sect. 5). The purple square denotes the region where CON-dominated sources are located (see Sect. 6). Colour-coded squares correspond to the host galaxy contribution of the track of simulated spectra for a galaxy containing a CON shown in Fig. 5.
Current usage metrics show cumulative count of Article Views (full-text article views including HTML views, PDF and ePub downloads, according to the available data) and Abstracts Views on Vision4Press platform.
Data correspond to usage on the plateform after 2015. The current usage metrics is available 48-96 hours after online publication and is updated daily on week days.
Initial download of the metrics may take a while.