| Issue |
A&A
Volume 663, July 2022
|
|
|---|---|---|
| Article Number | A73 | |
| Number of page(s) | 10 | |
| Section | Extragalactic astronomy | |
| DOI | https://doi.org/10.1051/0004-6361/202142733 | |
| Published online | 14 July 2022 | |
Constraining the radio properties of the z = 6.44 QSO VIK J2318−3113
1
INAF, Osservatorio Astronomico di Brera, Via Brera 28, 20121 Milano, Italy
e-mail: This email address is being protected from spambots. You need JavaScript enabled to view it.
2
DiSAT, Università degli Studi dell’Insubria, Via Valleggio 11, 22100 Como, Italy
3
Sydney Institute for Astronomy, School of Physics, University of Sydney, NSW 2006, Australia
4
CSIRO Space and Astronomy, PO Box 76 Epping, NSW 1710, Australia
5
ARC Centre of Excellence for Gravitational Wave Discovery (OzGrav), Hawthorn, VIC 3122, Australia
6
International Centre for Radio Astronomy Research, Curtin University, 1 Turner Avenue, Bentley, WA 6102, Australia
7
ARC Centre of Excellence for All-sky Astrophysics (CAASTRO), The University of Sydney, NSW 2006, Australia
8
Shanghai Astronomical Observatory, Chinese Academy of Sciences, Nandan Road 80, Shanghai 200030, PR China
9
Key Laboratory of Cognitive Radio and Information Processing, Guilin University of Electronic Technology, 541004 Guilin, PR China
10
CSIRO Space and Astronomy, PO Box 1130 Bentley, WA 6102, Australia
11
School of Natural Sciences, University of Tasmania, Private Bag 37, Hobart, TAS 7001, Australia
12
ARC Centre of Excellence for All-Sky Astrophysics in 3 Dimensions (ASTRO 3D), Australia
13
Department of Physics and Electronics, Rhodes University, PO Box 94 Makhanda 6140, South Africa
Received:
23
November
2021
Accepted:
11
March
2022
Abstract
The recent detection of the quasi-stellar object (QSO) VIKING J231818.3−311346 (hereafter VIK J2318−3113) at redshift z = 6.44 in the Rapid ASKAP Continuum Survey (RACS) uncovered its radio-loud nature, making it one of the most distant known to date in this class. By using data from several radio surveys of the Galaxy And Mass Assembly 23h field and from a dedicated follow-up, we were able to constrain the radio spectrum of VIK J2318−3113 in the observed range ∼0.1–10 GHz. At high frequencies (0.888–5.5 GHz in the observed frame) the QSO presents a steep spectrum (αr = 1.24, with Sν ∝ ν−αr), while at lower frequencies (0.4–0.888 GHz in the observed frame) it is nearly flat. The overall spectrum can be modelled by either a curved function with a rest-frame turnover around 5 GHz, or with a smoothly varying double power law that is flat below a rest-frame break frequency of about 20 GHz and above which it significantly steepens. Based on the model adopted, we estimated that the radio jets of VIK J2318−3113 must be a few hundred years old in the case of a turnover, or less than a few × 104 years in the case of a break in the spectrum. Having multiple observations at two frequencies (888 MHz and 5.5 GHz), we further investigated the radio variability previously reported for this source. We found that the marginally significant flux density variations are consistent with the expectations from refractive interstellar scintillation, even though relativistic effects related to the orientation of the source may still play a non-negligible role. Further radio and X-ray observations are required to conclusively discern the nature of this variation.
Key words: galaxies: active / galaxies: high-redshift / quasars: general / quasars: individual: VIKING J231818.3−311346 / radio continuum: galaxies / Galaxy: abundances
© ESO 2022
1. Introduction
High-redshift quasi-stellar objects (QSOs) are among the most important tools to investigate the properties of supermassive black holes (SMBHs) in the initial stages after their formation. QSOs able to expel part of the accreting material in the form of two bipolar relativistic jets (radio loud, RL1) are of particular interest since the presence of such jets can significantly affect the growth of the SMBH itself and also its environment (Blandford et al. 2019). While optical and infrared (IR) observations can be used to investigate the accretion process (e.g., Tang et al. 2019; Eilers et al. 2021) and its re-ionising effect on the surrounding intergalactic medium (e.g., Becker et al. 2019), radio and X-ray data are crucial to study the properties of the relativistic jets (e.g., Ighina et al. 2022) and their specific effect on the growth of SMBHs, the host galaxies, and the environments (e.g., Croston et al. 2019; Rojas-Ruiz et al. 2021).
As a result of ongoing and upcoming wide-area radio surveys with the Square Kilometre Array (SKA; Braun et al. 2015) and its precursors (e.g., Norris et al. 2021; Murphy et al. 2021), we will be able to use deep multi-band radio data to discover and study statistical samples of RL sources even at the highest redshifts (z > 6), where only a small number of RL active galactic nuclei (AGNs) have been found so far (see e.g., Table 6 in Bañados et al. 2021). The systematic characterisation of these objects, such as their spectral shape and their short- and long-term variability, will provide unique information on the first phases of the launch and propagation of relativistic jets from young SMBHs (e.g., Nyland et al. 2020) and their connection with the powerful large-scale radio galaxies observed in the local Universe (e.g., Alexander 2000; Oei et al. 2022).
The first z > 6 QSO whose RL nature was uncovered because of the new generation of all-sky radio surveys is VIKING J231818.3−311346 (hereafter VIK J2318−3113; Ighina et al. 2021), which was discovered in the Rapid ASKAP Continuum Survey (RACS; McConnell et al. 2020). In this work we present the radio properties of this source, focussing on its spectral shape and variability. The work is based on radio data obtained with the Murchison Widefield Array (MWA; Tingay et al. 2013), the Australia Telescope Compact Array (ATCA; Wilson et al. 2011), and the Australian Square Kilometre Array Pathfinder (ASKAP; Johnston et al. 2007; Hotan et al. 2021) as part of the Galaxy And Mass Assembly (GAMA; Driver et al. 2011) 23h field and through dedicated follow-up observations.
Throughout the paper we assume a flat lambda cold dark matter (ΛCDM) cosmology with H0 = 70 km s−1 Mpc−1, ΩM = 0.3, and ΩΛ = 0.7, where 1″ corresponds to a projected distance of 5.49 kpc at z = 6.44. Spectral indices are given assuming Sν ∝ ν−α and all errors are reported at 68% confidence unless specified otherwise.
2. Multi-wavelength spectral energy distribution of VIK J2318−3113
Thanks to the multi-frequency data available for VIK J2318−3113, we were able to constrain its spectral energy distribution (SED) from the radio (∼109 Hz) to the optical band (∼1015 Hz). The SED is shown in Fig. 1. Optical and near-IR data (Z, Y, J, H, and Ks bands; 0.1–0.3 μm in the source’s rest frame) from the VISTA Kilo-Degree Infrared Galaxy Survey (VIKING; Edge et al. 2013) and the W1–W2 IR bands (0.5–0.6 μm rest frame) from the Wide-field Infrared Survey Explorer (Wright et al. 2010) catalogue (catWISE; Eisenhardt et al. 2020) are reported as orange and brown triangles. In addition to the detections in these surveys, VIK J2318−3113 has also been targeted with the Atacama Large Millimetre/submillimetre Array (ALMA; Wootten & Thompson 2009). Specifically, the source was first observed in band 6 (247 GHz, Sν = 0.36 ± 0.08 mJy; see Decarli et al. 2018 and Venemans et al. 2020) and then in band 3 (102 GHz, Sν = 0.05 ± 0.01 mJy; P.I. R. Decarli, project code: 2019.1.00147.S). This last value is the peak flux density measured in the calibrated image obtained from the standard reduction ALMA pipeline. We report these data, which correspond to the 750–1900 GHz or 160–400 μm range in the source rest frame, as blue squares in Fig. 1.
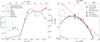 |
Fig. 1. Multi-frequency and radio SED of VIK J2318−3113. Left panel: radio-to-optical and UV rest-frame SED of VIK J2318−3113. The solid black line and the dashed blue line are two templates of a QSO and a starbust galaxy from Polletta et al. (2007). Their sum (dashed–dotted magenta line) was normalised to the VIKING–catWISE (orange and brown triangles) and the ALMA (blue squares) data points and then extended in the radio band with a |

We normalised the sum of the QSO and the starburst galaxy (M 82) templates from Polletta et al. (2007) to the available optical and IR observations and then extended it to lower radio frequencies assuming a power law with a spectral index  (Condon et al. 2002). The corresponding shaded area represents a different normalisation of the template that takes into account the uncertainty on the ALMA data and also a different slope of the radio emission (
 –0.8; Pérez-Torres et al. 2021). Based on the expected contribution from the synchrotron emission in star-forming (SF) galaxies (see Fig. 1), it is clear that the observed radio emission in VIK J2318−3113 is dominated by the AGN activity. Therefore, the observed features of the radio spectrum should be directly linked to the radiation produced within the jet and its characterisation can provide useful insight into its properties.
3. Radio data
The detection of VIK J2318−3113 at 888 MHz in the first data release of the low-band RACS survey revealed its RL nature. Nevertheless, this source is too faint to be detected in the majority of publicly available radio surveys. As reported in Ighina et al. (2021), VIK J2318−3113 is not detected in the Tata Institute of Fundamental Research Giant Metrewave Telescope (GMRT) Sky Survey (TGSS; Intema et al. 2017), the Sydney University Molonglo Sky Survey (SUMSS; Bock et al. 1999; Mauch et al. 2003; Murphy et al. 2007), or the National Radio Astronomy Observatory Very Large Array Sky Survey (NVSS; Condon et al. 1998). The only detection is at 3 GHz (signal-to-noise ratio, S/N = 3) from the second epoch of the Karl G. Jansky Very Large Array (JVLA) Sky Survey (VLASS; Lacy et al. 2020).
After the publication of Ighina et al. (2021), the official catalogue of the first low-band epoch of the RACS survey was published (Hale et al. 2021). This catalogue was built by combining all the tiles between −80° < Dec < 30° and by convolving them to a common resolution of 25″. In this work we adopt the values of VIK J2318−3113 reported in this catalogue as best-fit measurements of the RACS low-band observations ( mJy beam−1 and rms = 0.22 mJy beam−1). These values are slightly different, but still consistent, compared to the ones reported in Ighina et al. (2021). This is because the value reported in Hale et al. (2021) is the combination of multiple observations where VIK J2318−3113 is on the edge of the field of view.
In this section we give a brief description of further observations available for VIK J2318−3113, either as part of the GAMA project or through dedicated follow-up observations. A summary of the data used in this work is given in Table 1 and we present the corresponding radio images in Appendix A. We also include a new observation from the RACS mid-band survey (at 1.37 GHz, as opposed to low-band at 888 MHz). The overall data reduction for the second release of the RACS survey is still in progress, but it is very similar to the process carried out for the first low-band data release (see McConnell et al. 2020 for a description).
Summary of all the observations available for VIK J2318−3113.
3.1. GAMA 23 field radio observations
VIK J2318−3113 is located in the GAMA 23h field (G23), which has been covered by several deep radio observations spanning a large range of frequencies, from ∼0.1 to ∼5 GHz. The G23 field was observed with ASKAP as part of the Evolutionary Map of the Universe (EMU; Norris et al. 2011) Early Science Project; details on these observations relevant to VIK J2318−3113 are reported in Ighina et al. (2021).
The lower-frequency observations (154–216 MHz) have been performed with the MWA in its extended configuration (MWA Phase II; Wayth et al. 2018) as part of the MWA Interestingly Deep Astrophysical Survey (MIDAS; Quici et al., in prep.). Depending on the frequency, the RMS reached by the observations is 0.99 mJy beam−1 at 154 MHz and 0.54 mJy beam−1 at 216 MHz, while the spatial resolution is between 1′ and 1.5′ for both images. In the following, we adopt the conservative value of 8% for the uncertainty on the flux scale, which is based on the comparison between the MIDAS images and the GaLactic and Extra-galactic All-sky MWA (GLEAM; Wayth et al. 2015) survey (extra-galactic data release: Hurley-Walker et al. 2017). Readers can refer to Sect. 2.1.2 in Quici et al. (2021) for further details.
As part of the GAMA Legacy ATCA Sky Survey (GLASS), the G23 field has also been covered at 399 MHz with the upgraded GMRT (uGMRT; Gupta et al. 2017), and at 5.5 GHz with ATCA. The 399-MHz image reaches a sensitivity of 0.1 mJy beam−1 and a resolution of ∼10″ near VIK J2318−3113. In addition, the ATCA observations were conducted with the extended 6A configuration, reaching a resolution of ∼4″, an rms of 32 μJy beam−1 at 5.5 GHz. We adopted an uncertainty on the absolute flux scale of 10% and 5% for the uGMRT and ATCA images, respectively.
3.2. Dedicated simultaneous follow-up observations
Given the relatively large and rapid variability observed at 888 MHz in Ighina et al. (2021), we also carried out a simultaneous follow-up at different frequencies with the ASKAP and ATCA telescopes on 2021 February 28. The ASKAP observation was reduced using the ASKAPsoft data-reduction pipeline (Guzman et al. 2019) and it is publicly available in the CSIRO ASKAP Science Data Archive2 (CASDA; Huynh et al. 2020) under the identification code SBID 23721. Similarly to the first data release of the RACS survey, it has a bandwidth of 288 MHz centred at 888 MHz. The angular resolution is ∼12″ and the off-source RMS is 33 μJy beam−1. We adopted an uncertainty of 10% on the absolute flux scale.
The follow-up with ATCA was carried out in the 6D array configuration at three different frequencies, 2.1, 5.5, and 9 GHz (project CX481), with the corresponding restored beam sizes (rms) of 17.5″ × 3.9″(36 μJy beam−1), 7.6″ × 1.4″(20 μJy beam−1), and 5.9″ × 1.1″(17 μJy beam−1), respectively. The absolute flux scale calibration was made with the PKS 1934−638, and the resulting uncertainty that we adopted is 5%.
4. Radio spectrum
In Fig. 1 (right panel) we show all the radio measurements available for VIK J2318−3113 based on the projects under which the single observations were taken. The VLASS data at 3 GHz come from the quick-look images of the survey, which have been shown to be potentially unreliable at faint fluxes. For this reason we added a further 15% uncertainty to these measurements; readers can refer to Gordon et al. (2021) for further details. Upper limits are at the 3σ level, and Baars et al. (1977) is our reference flux density scale. Where needed, we accounted for the offset between the Baars et al. (1977) scale and other flux density scales by scaling the total flux density and including an appropriate uncertainty in the estimate of their error. Based on the simultaneous detections only, the radio spectrum of VIK J2318−3113 can be described by a single power law with a slope of αr = 1.24 ± 0.04 (dashed red line in Fig. 1) between the 888 MHz and 5.5 GHz observed frequencies (corresponding to the rest-frame range ∼7–40 GHz). This value is consistent to what is normally found in other RL QSOs at similar frequencies (e.g., Bruni et al. 2012), even when considering the few at z > 6 (Frey et al. 2011; Bañados et al. 2021). However, the non-detection at 9 GHz might imply a steepening of the spectrum at higher frequencies, again, in a similar way to what has been observed in other high-redshift radio sources (e.g., Drouart et al. 2020; An et al. 2022).
Even though the best way to characterise the shape of the intrinsic spectrum would be from simultaneous data points in order to constrain a much larger range of frequencies, we also consider non-simultaneous observations with the caveat that the following considerations may vary based on the degree of variability of the source (see Sect. 5). While the available data between 0.888 and 5.5 GHz (in the observed frame) are consistent with the steep spectrum inferred from the simultaneous measurements, the non-detections from the MWA and TGSS surveys, together with the measurement from GLASS–uGMRT seem to indicate a flattening of the radio spectrum at lower frequencies. This feature could either be related to the presence of a turnover at low frequencies or to a flat radio spectrum that steepens at higher frequencies. In the following we discuss both possibilities together with their physical implications.
4.1. Curved spectrum
A turnover in the radio spectrum has already been observed in many objects, referred to as ‘peaked-spectrum’ (PS) radio sources, and it is normally associated with the young age of the radio jet responsible for the radio emission (e.g., O’Dea & Saikia 2021). The most likely explanations for the presence of the turnover are synchrotron self-absorption (SSA) or free–free absorption (FFA). While determining the specific mechanism that is responsible for the turnover in a given source can be of great importance in understanding either its intrinsic properties or the external environment in which the source resides, it is often hard to uniquely distinguish between the two scenarios, especially as they could both occur at the same time. Therefore, in order to constrain the frequency at which the potential turnover occurs in VIK J2318−3113, we performed a fit to the overall radio data available with a generic curved spectrum, given by the following:
 (1)
(1)
where N is the normalisation and the q parameter is a measurement of the curvature of the spectrum (|q|> 0.2 characterises a significantly curved spectrum; Callingham et al. 2017) and it is related to the peak frequency as νpeak = eα/2q.
We performed the fit in the source’s rest frame using the MrMoose3 code (see full description in Drouart & Falkendal 2018a,b), which takes the upper limits available for VIK J2318−3113 into account (especially from MWA and ATCA at < 200 MHz and 9 GHz, respectively). The best-fit function is reported as a solid black line in Fig. 1. With this model, the resulting peak frequency of VIK J2318−3113 is at 4.8 ± 0.6 GHz ( and
and  ), which corresponds to about 650 MHz in the observed frame, similar to the values observed in other z > 5 RL QSOs (e.g., Shao et al. 2022).
Several studies have now consolidated the relation between the peak frequency and linear size in these PS systems (e.g., Jeyakumar 2016), where the higher the peak frequency, the more compact (i.e., younger) the radio jet is. Therefore, we can use the turnover frequency derived from the curved spectrum fit above and the relation derived in Orienti & Dallacasa (2014) to obtain a rough estimate (given the large scatter of the relation; e.g. Nyland et al. 2020) of the expected linear size of the relativistic jets in VIK J2318−3113: ∼30 pc . If we consider an average expansion velocity of ∼0.2c (typical for jets with similar luminosities, e.g., An & Baan 2012), the corresponding kinetic age of the radio jet would be ∼500 years, that is, a relatively newborn jet (e.g., Gugliucci et al. 2005).
4.2. Double power law
In addition to a curved spectrum, which could be physically motivated for young radio sources, we also used a smooth double power law model to fit the radio emission of VIK J2318−3113. In this case the steepening of the spectrum at a higher frequency could be related to the radiative cooling of the most energetic electrons (e.g., through the synchrotron or inverse Compton, IC, processes). The double power law model we used is given by
![Mathematical equation: $$ \begin{aligned} S_\nu = N \, \nu ^{-\alpha _{\rm low}} \, \left[\, 1 + \left(\frac{\nu }{\nu _{\rm b}}\right)^{|\alpha _{\rm low}-\alpha _{\rm high}| } \right]^{\,\mathrm{-sgn}( \alpha _{\rm high}-\alpha _{\rm low})}; \end{aligned} $$](/articles/aa/full_html/2022/07/aa42733-21/aa42733-21-eq8.gif) (2)
(2)
in this case, we found that the best-fit spectrum (again using the MrMoose code) would be nearly flat ( ) below the break frequency (νb = 20.5 ± 7.1 GHz, in the rest frame) and then it would sharply steepen afterwards (
 ). The best-fit double power law is reported in Fig. 1 as a dotted purple line. It is worth highlighting the significant steepening of the radio spectrum that is needed in this scenario, αhigh − αlow ∼ 3. Given the very high redshift of VIK J2318−3113, this could be the result of the IC scattering off the cosmic microwave background (CMB; e.g., Ghisellini et al. 2015). Indeed, at z = 6.44, the equivalent magnetic field associated with the CMB energy density is BIC = 176 μG, which could potentially dominate the energy losses of high-energy electrons.
From the value of the potential break frequency and a reasonable assumption of the magnetic field strength, we can infer the radiative age of the radio jet and its electron population; readers can refer to Eq. (1) in Morabito et al. (2016), for example, for more details. Given the rather strong dependence of the radiative age on the assumed magnetic field, we can consider two main scenarios. If the radio emission of VIK J2318−3113 is dominated by the most extended regions, where the magnetic field is weaker, the observed spectrum is dominated by IC losses. In this case, assuming a typical magnetic field of the order of ∼10 μG (e.g., Croston et al. 2005), the corresponding radiative age is ∼4 × 10⁴ yr. If instead the observed radio emission is produced in very compact regions (e.g., in small hot spots or in the vicinity of the SMBH), the magnetic field strength can even be > 1 mG (e.g., Keim et al. 2019), which would correspond to a radiative age < 104 yr. Finally, the maximum value of the radio jets’ age, ∼9 × 10⁴ yr, is obtained for moderate magnetic fields ∼100 μG (1/ times the BIC) and, therefore, for physical conditions in between the two previous scenarios. Based on the range of radiative age values just derived, < 105 yr, we can conclude that VIK J2318−3113 is likely a relatively young radio source similar to most compact steep spectrum radio sources (e.g., Murgia et al. 1999).
Since both the curved spectrum and double power law can fit our current data well and be physically motivated, we cannot determine which spectral shape is more representative of the intrinsic emission of VIK J2318−3113. Simultaneous follow-up observations covering a broad frequency range (e.g., 0.1–10 GHz) will be needed to constrain its spectrum and thus understand the physical mechanisms responsible for it.
5. Variability
In Ighina et al. (2021), by comparing the ASKAP images of VIK J2318−3113 at 888 MHz from RACS and the G23 project, we found that the radio emission of the source might be highly variable. Having an additional deep observation at 888 MHz and two new data points at 5.5 GHz, we can now put further constraints on the variability of VIK J2318−3113. In particular, from Fig. 1 and Table 1 it seems that variability is especially relevant at lower frequencies, where the flux density estimates at 888 MHz are inconsistent. In contrast, at 5.5 GHz, the data points (though only two) are fully consistent. For the moment, we can only investigate the variability of the source in the radio band since there are no multi-epoch observations in other electromagnetic bands. Further multi-wavelength observations will allow us to expand this study and to have a more comprehensive understanding of this source.
In order to see if variability was still relevant with the new available data sets, we checked the consistency of the G23 image with the new RACS catalogue from Hale et al. (2021) as well as with the one available from the dedicated follow-up, which has a sensitivity similar to the G23 observation (rms ∼ 0.04 mJy beam−1). Following the previous approach (Ighina et al. 2021), we compared the flux densities of nearby sources (≲1 deg from VIK J2318−3113) above 1 mJy (when considering the RACS catalogue) and above 0.2 mJy (when comparing the G23 and the follow-up images) for sources unresolved both in the G23 and follow-up images (Sint/Speak < 1.3). We note that while for the G23 and follow-up images we considered the integrated flux densities obtained from a 2D Gaussian fit performed with the Common Astronomy Software Applications (CASA; McMullin et al. 2007), for the estimates from the RACS catalogue, we considered the peak flux densities since at faint fluxes the 2D Gaussian fit may not be reliable (see Sect. 5 and Fig. 8 in Hale et al. 2021). From the comparison of the three images, we found that the distributions of the flux density ratios indicate that the different calibrations are consistent with each other with offsets of always < ±0.1 mJy (i.e., smaller than the statistical errors on the estimates).
We note that the observed discrepancy between the G23 flux density and the other measurements is at about the 2.5–3σ level and therefore further observations are needed to ultimately confirm the physical nature of the variability in the radio emission of VIK J2318−3113. However, if we interpret this discrepancy as true variability of the source and not statistical fluctuations, current data suggest that it is not due to calibration effects, but rather it must be either an intrinsic variation (i.e., related to a change in the jet’s properties) or extrinsic (i.e., related to a phenomenon external to the AGN and its jet), or a combination of both of them. In the following, both scenarios are discussed and evaluated.
In order to quantify the amount of variability present in VIK J2318−3113, we used the modulation index, defined as M = σ/S̄, where σ is the standard deviation and S̄ is the mean of the observed flux densities. At 888 MHz, we found that M = 33% (σ = 0.30 mJy beam−1 and S̄ = 0.92 mJy beam−1); whereas, if the debiased modulation index is considered (e.g., Eq. (6) in Bell et al. 2014), Mdeb = 22% is obtained.
5.1. Intrinsic variability
If the flux variation at 888 MHz is intrinsic to the jet, we can obtain a qualitative estimate of the maximum size of the jet’s variable component by using the light-crossing time: r = τc. The time that elapsed between the minimum and maximum flux densities of VIK J2318−3113 is τ = 50 days (about one year in the observed frame), which corresponds to a size of r ≤ 0.04 pc. This value is only a rough upper limit of the actual size of the varying component in the jet since it is based on the observation dates, which may not be representative of the intrinsic timescales of the source.
Assuming that the SMBH hosted in VIK J2318−3113 has a mass of ∼109 M⊙ (as is typically observed in other QSOs at these redshifts; e.g., Mazzucchelli et al. 2017; Belladitta et al. 2022), this size corresponds to ∼400 Schwarzschild radii (RSc)4. This limit is consistent with the typical transverse size observed in low redshift jets up to a few thousand RSc from the central SMBH (e.g., Hada et al. 2013). Detailed studies in the local Universe have shown that at these scales’ relativistic jets are still accelerating and undergoing collimation (e.g., Mertens et al. 2016). At the same time, they can also show signs of mild relativistic boosting (e.g., Kim et al. 2018). We can therefore use the Compton catastrophe limit on the brightness temperature (TB < 1012 K; Kellermann & Pauliny-Toth 1969) to determine whether relativistic beaming plays an important role in the radio emission and variability of VIK J2318−3113. Following Miller-Jones et al. (2008), the brightness temperature, and thus the Compton catastrophe limit, can be written as follows:
 (3)
(3)
where ΔSν is the amplitude of the variation (0.58 mJy), ν is the observed frequency (888 MHz), and c and k are the speed of light and Boltzmann’s constant, respectively. In addition, Ω is the solid angle subtended by the source and can be expressed as  , where r is the source linear size and dA is the angular distance to the source (1131 Mpc). Since VIK J2318−3113 is not resolved in any radio image, we assume the upper limit given by the light-crossing distance (r = 0.04 pc). With these values we find a brightness temperature of TB ≈ 1.4 × 10¹⁴ K, which is a lower limit to the actual value since we do not know the exact dimensions of the emitting region. From this estimate, we can now derive the corresponding limit on the relativistic Doppler factor5 (δ), where the observed brightness temperature value scales as δ3Tintrinsic (Lähteenmäki & Valtaoja 1999). For VIK J2318−3113 we find that δ ≳ 5, which would constrain the Doppler factor to values normally observed in radio QSOs whose jets are closely aligned to our line of sight, such as blazars (e.g., Hovatta et al. 2009; Zhang et al. 2020; Homan et al. 2021). This indicates that relativistic beaming might play an important role in the observed radio emission of VIK J2318−3113. Moreover, in this case we would also expect the source to have a flat radio spectrum (αr ≲ 0.5; e.g., Padovani 2017; Caccianiga et al. 2019), which is in contrast with the slope measured for VIK J2318−3113: αr = 1.24. Nevertheless, a few exceptions are known where the high-redshift source, despite showing signs of relativistic beaming (with bulk Lorentz factors smaller that the average), presents a relatively steep spectrum (e.g., An et al. 2020; Spingola et al. 2020).
Another possibility, independent of orientation effects, is that the observed variation could be due to the evolution of the jet itself and its expansion in the circumnuclear medium. If VIK J2318−3113 is indeed a very young radio source (as hinted to by the potential presence of a turnover in the radio spectrum; see Sect. 4), we expect its emission to vary as the jets grow in size (e.g., Nyland et al. 2020). In particular, we expect the flux density to change, mainly close to the peak of the spectrum, as observed in VIK J2318−3113, with an increase in the optically thick part (i.e., lower frequencies than the turnover) and a decrease in the optically thin part (e.g., Orienti 2016). Nevertheless, in order to observe variations of a factor ∼2, the typical timescale would need to be at least several months (Pradio ∝ t2/5, e.g., An & Baan 2012), which is larger than the range sampled by our data. Therefore, it is likely that variations related to the expansion of a young jet, if present, are only of secondary importance (unless strong relativistic beaming is present, which would increase the rest-frame time by a factor δ).
5.2. Extrinsic variability
Another possibility is that the observed variability in VIK J2318−3113 is caused by refractive interstellar scintillation (RISS). This process occurs when radio waves from sources propagate through the interstellar medium (ISM) of our Galaxy (see e.g., Narayan 1992 for a detailed description). Since the ISM is composed of charged plasma, a variation in its density would deform the wave-front of the incoming radiation from a compact background object, causing a phase delay that can lead to a variation in the observed flux density. The amount and the timescale of the variation depend on the column density of the electrons within the Milky Way along the line of sight (i.e., the position in the sky, l = 15.942° and b = −69.303° in Galactic coordinates) as well as the observing frequency.
In order to determine the distribution of the electrons in our Galaxy, and therefore the expected amount of variation from RISS, we used the NE2001 code developed by Cordes & Lazio (2002, 2003) 6. In particular, with this code, we derived the transitional frequency (ν0) that separates the strong scattering regime (below ν0) from the weak one. At the position of VIK J2318−3113 we obtain ν0 ∼ 7.9 GHz, which means that observations at 888 MHz are sensitive to strong RISS. Based on the equation in Sect. 3.2.1 in Walker (1998), the variations corresponding to this transitional frequency have a modulation index of ∼29% and typical timescales of ∼10 days. Even though the separation between our data is larger (one year between each data point; two years in total), this flux density variation is consistent with the modulation index measured (both debiased and not) in VIK J2318−3113. It is therefore likely that the observed variation of VIK J2318−3113 is mainly related to the scintillation of the ISM in our own Galaxy, rather than an intrinsically variable radio jet. However, given the limited data available, a systematic monitoring of VIK J2318−3113 at different frequencies will be essential to better understand the variable nature of this source.
If RISS is the main mechanism responsible for the flux density variation in VIK J2318−3113, we could set a qualitative limit on the size of the region potentially related to RISS (θs). Indeed, for refractive scintillation, above a certain angular size cutoff θlim (which depends on the position on the sky), angular broadening will take place and the scintillation as well as the modulation index will be quenched by a factor (θlim/θs)7/6. At 888 MHz and at the position of VIK J2318−3113, θlim ∼ 1 mas, which corresponds to a projected size of ∼5 pc. This means that even if RISS is responsible for variability, the radio emitting region in VIK J2318−3113 should be concentrated in an area of a similar spatial extent, which is smaller than typical sizes of newly born radio galaxies (e.g., Polatidis & Conway 2003). Therefore, also in this case, projection effects related to a jet closely oriented to the line of sight must take place.
6. Discussions and conclusions
Having more reliable knowledge of the radio spectrum of VIK J2318−3113 with respect to Ighina et al. (2021), we can now better constrain its radio luminosity and radio-loudness parameter in order to compare it to other QSOs. Based on the curved power law obtained from the fit of all the available data, the average radio luminosity at a rest-frame frequency of 5 GHz is L5 GHz = 5.5 ± 1.3 × 1025 W Hz−1, which corresponds to a radio loudness of R4400 Å = 31.2 ± 7.5 or R2500 Å = 42.3 ± 10.1, where the errors were computed using the debiased modulation index at 888 MHz. According to these values, VIK J2318−3113 is among the faintest RL QSOs at high redshift in the radio band (see e.g., Table 6 in Bañados et al. 2021).
Although its faintness is subject to variability, it could also be related to the young age of the radio jet. Indeed the steep radio spectrum of the source and the presence of a turnover at a few gigahertz in the rest frame are typical features of compact radio jets in their first expanding phases (O’Dea 1998; O’Dea & Saikia 2021). The linear size derived for VIK J2318−3113 from the Orienti & Dallacasa (2014) relation for PS radio sources (∼30 pc) is larger than the limits we found through variability arguments in the previous section. This could mean that the majority of the emission is concentrated in the innermost regions of the source, even if the jets extend up to tens of parsecs, as observed in other radio jets (e.g., Turner et al. 2012). Moreover, the orientation of the jet might play an important role in the observed size and, therefore, the derived values are only indicative. From the highest-resolution image we can only set an upper limit on the source’s size of about 8.3 kpc (from the major axis of the ATCA follow-up at 5.5 GHz and Eq. (14.5) in Fomalont 1999). Hence, Very Long Baseline Interferometry (VLBI) is needed to firmly constrain the dimensions of the source.
Moreover, we further investigated the variability around 888 MHz in the observed frame, which has a significance of 2.5–3σ. If confirmed, the corresponding varying region is likely very compact in spatial extent (smaller than ∼5 parsec), regardless of its origin. The amplitude of the flux density variation observed in VIK J2318−3113 is consistent with the expectations from RISS; however, we cannot exclude that it may be also related to an intrinsic change in the intensity of the source. In this case, the corresponding size of the varying region could even be of the order of∼400 RSc. Nevertheless, we stress that current data are not sufficient to conclusively determine the origin of such variability; further radio observations at different frequencies and timescales along with complementary X-ray data would be required.
Bañados et al. (2021) recently discovered a RL QSO at z = 6.82, PSO J172.3556+18.7734, which has similar radio characteristics (slope and luminosity; also see Momjian et al. 2021) to VIK J2318−3113. Interestingly, this source also varied by a factor ∼2 at 1.4 GHz, even though in this case the flux diminished on a considerably longer timescale (17 years in the observed frame). At the same time, the non-detection of this source in the TGSS and RACS surveys implies that its radio spectrum flattens below 1 GHz in the observed frame, which could also be associated with the presence of a turnover. Together with a kinematic age similar to VIK J2318−3113 (∼1700 years; Momjian et al. 2021), its properties suggest that, also in this case, the radio emission originates from a relatively young jet. Similar conclusions were also reached for the majority of the other z > 5 RL QSOs (e.g., Frey et al. 2008, 2011; Shao et al. 2022).
The existence of VIK J2318−3113 and the other few known PS sources at z ≳ 6 with similar radio properties (discovered from optical and near-IR surveys) suggests that they are part of a much larger population of newly born radio jets present at the end of (and possibly during) the epoch of re-ionisation. In addition, the curvature of the radio spectrum of VIK J2318−3113 is consistent with the criteria adopted by Drouart et al. (2020) in order to efficiently identify high-redshift radio sources, even though their selection method focusses on lower frequencies (70–230 MHz, within the observable range of the MWA) and it would thus miss this source. However, a similar approach could be used to select high-frequency PS objects by combining multi-frequency data points from ongoing and upcoming radio surveys, such as the low, mid, and high bands of RACS (700–1800 MHz; McConnell et al. 2020) as well as higher frequency surveys (VLASS 3 GHz; Lacy et al. 2020).
From the observational point of view, we define a source to be radio loud if the rest-frame flux density ratio S5 GHz/S4400 Å > 10 (Kellermann et al. 1989). Even though this threshold has been shown to be rather simplistic in the separation between jetted and non-jetted QSOs (e.g., Padovani 2017), throughout the paper we use the terms jetted and RL interchangeably for simplicity and consistency with other works.
Defined as RSc = 2GM/c2, where G is the gravitational constant, M is the object mass and c is the speed of light.
δ = 1/Γ (1 − β cos θv), where Γ is the bulk Lorentz factor of the emitting region, β = v/c, and θv is the viewing angle.
We made use of the python version of the code ‘pyne2001’, available at: https://pypi.org/project/pyne2001/
Acknowledgments
We want to thank the anonymous referee for their corrections and suggestions that improved the quality of the paper. In this work we have used data from the ASKAP observatory. The Australian SKA Pathfinder is part of the Australia Telescope National Facility which is managed by CSIRO. Operation of ASKAP is funded by the Australian Government with support from the National Collaborative Research Infrastructure Strategy. ASKAP uses the resources of the Pawsey Supercomputing Centre. Establishment of ASKAP, the Murchison Radio-astronomy Observatory and the Pawsey Supercomputing Centre are initiatives of the Australian Government, with support from the Government of Western Australia and the Science and Industry Endowment Fund. We acknowledge the Wajarri Yamatji people as the traditional owners of the Observatory site. This scientific work makes use of the Murchison Radio-astronomy Observatory, operated by CSIRO. We acknowledge again the Wajarri Yamatji people as the traditional owners of the Observatory site. Support for the operation of the MWA is provided by the Australian Government (NCRIS), under a contract to Curtin University administered by Astronomy Australia Limited. We acknowledge the Pawsey Supercomputing Centre which is supported by the Western Australian and Australian Governments. This paper includes archived data obtained through the CSIRO ASKAP Science Data Archive, CASDA (http://data.csiro.au). The Australia Telescope Compact Array is part of the Australia Telescope National Facility which is funded by the Australian Government for operation as a National Facility managed by CSIRO. We acknowledge the Gomeroi people as the traditional owners of the Observatory site. This paper makes use of the following ALMA data: ADS/JAO.ALMA#2019.1.00147.S. ALMA is a partnership of ESO (representing its member states), NSF (USA) and NINS (Japan), together with NRC (Canada), MOST and ASIAA (Taiwan), and KASI (Republic of Korea), in cooperation with the Republic of Chile. The Joint ALMA Observatory is operated by ESO, AUI/NRAO and NAOJ. LI, SB, AC, AM acknowledge financial contribution from the agreement ASI-INAF n. I/037/12/0 and n.2017-14-H.0 and from INAF under PRIN SKA/CTA FORECaST. JL and JP are supported by Australian Government Research Training Program Scholarships. YW is supported by the China Scholarship Council. This research made use of the Common Astronomy Software Applications package (CASA), McMullin et al. (2007). This research made use of Astropy (http://www.astropy.org) a community-developed core Python package for Astronomy (Astropy Collaboration 2018).
References
- Alexander, P. 2000, MNRAS, 319, 8 [Google Scholar]
- An, T., & Baan, W. A. 2012, ApJ, 760, 77 [Google Scholar]
- An, T., Mohan, P., Zhang, Y., et al. 2020, Nat. Commun., 11, 143 [Google Scholar]
- An, T., Wang, A., Zhang, Y., et al. 2022, MNRAS, 511, 4572 [NASA ADS] [CrossRef] [Google Scholar]
- Astropy Collaboration (Price-Whelan, A. M., et al.) 2018, AJ, 156, 123 [Google Scholar]
- Bañados, E., Mazzucchelli, C., Momjian, E., et al. 2021, ApJ, 909, 80 [CrossRef] [Google Scholar]
- Baars, J. W. M., Genzel, R., Pauliny-Toth, I. I. K., & Witzel, A. 1977, A&A, 500, 135 [NASA ADS] [Google Scholar]
- Becker, G. D., Pettini, M., Rafelski, M., et al. 2019, ApJ, 883, 163 [NASA ADS] [CrossRef] [Google Scholar]
- Bell, M. E., Murphy, T., Kaplan, D. L., et al. 2014, MNRAS, 438, 352 [NASA ADS] [CrossRef] [Google Scholar]
- Belladitta, S., Caccianiga, A., Diana, A., et al. 2022, A&A, 660, A74 [NASA ADS] [CrossRef] [EDP Sciences] [Google Scholar]
- Blandford, R., Meier, D., & Readhead, A. 2019, ARA&A, 57, 467 [NASA ADS] [CrossRef] [Google Scholar]
- Bock, D. C. J., Large, M. I., & Sadler, E. M. 1999, AJ, 117, 1578 [Google Scholar]
- Braun, R., Bourke, T., Green, J. A., Keane, E., & Wagg, J. 2015, in Advancing Astrophysics with the Square Kilometre Array (AASKA14), 174 [Google Scholar]
- Bruni, G., Mack, K. H., Salerno, E., et al. 2012, A&A, 542, A13 [NASA ADS] [CrossRef] [EDP Sciences] [Google Scholar]
- Caccianiga, A., Moretti, A., Belladitta, S., et al. 2019, MNRAS, 484, 204 [NASA ADS] [CrossRef] [Google Scholar]
- Callingham, J. R., Ekers, R. D., Gaensler, B. M., et al. 2017, ApJ, 836, 174 [CrossRef] [Google Scholar]
- Condon, J. J., Cotton, W. D., & Broderick, J. J. 2002, AJ, 124, 675 [Google Scholar]
- Condon, J. J., Cotton, W. D., Greisen, E. W., et al. 1998, AJ, 115, 1693 [Google Scholar]
- Cordes, J. M., & Lazio, T. J. W. 2002, ArXiv e-prints, [arXiv:astro-ph/0207156] [Google Scholar]
- Cordes, J. M., & Lazio, T. J. W. 2003, ArXiv e-prints [arXiv:astro-ph/0301598] [Google Scholar]
- Croston, J. H., Hardcastle, M. J., Harris, D. E., et al. 2005, ApJ, 626, 733 [NASA ADS] [CrossRef] [Google Scholar]
- Croston, J. H., Hardcastle, M. J., Mingo, B., et al. 2019, A&A, 622, A10 [NASA ADS] [CrossRef] [EDP Sciences] [Google Scholar]
- Decarli, R., Walter, F., Venemans, B. P., et al. 2018, ApJ, 854, 97 [Google Scholar]
- Driver, S. P., Hill, D. T., Kelvin, L. S., et al. 2011, MNRAS, 413, 971 [Google Scholar]
- Drouart, G., & Falkendal, T. 2018a, MNRAS, 477, 4981 [NASA ADS] [CrossRef] [Google Scholar]
- Drouart, G., & Falkendal, T. 2018b, Astrophysics Source Code Library [record ascl:1809.015] [Google Scholar]
- Drouart, G., Seymour, N., Galvin, T. J., et al. 2020, PASA, 37, e026 [Google Scholar]
- Edge, A., Sutherland, W., Kuijken, K., et al. 2013, The Messenger, 154, 32 [NASA ADS] [Google Scholar]
- Eilers, A.-C., Hennawi, J. F., Davies, F. B., & Simcoe, R. A. 2021, ApJ, 917, 38 [NASA ADS] [CrossRef] [Google Scholar]
- Eisenhardt, P. R. M., Marocco, F., Fowler, J. W., et al. 2020, ApJS, 247, 69 [Google Scholar]
- Fomalont, E. B. 1999, in Synthesis Imaging in Radio Astronomy II, eds. G. B. Taylor, C. L. Carilli, & R. A. Perley, ASP Conf. Ser., 180, 301 [Google Scholar]
- Frey, S., Gurvits, L. I., Paragi, Z., & Gabányi, K. É. 2008, A&A, 484, L39 [NASA ADS] [CrossRef] [EDP Sciences] [Google Scholar]
- Frey, S., Paragi, Z., Gurvits, L. I., Gabányi, K. É., & Cseh, D. 2011, A&A, 531, L5 [NASA ADS] [CrossRef] [EDP Sciences] [Google Scholar]
- Ghisellini, G., Haardt, F., Ciardi, B., et al. 2015, MNRAS, 452, 3457 [Google Scholar]
- Gordon, Y. A., Boyce, M. M., O’Dea, C. P., et al. 2021, ApJS, 255, 30 [NASA ADS] [CrossRef] [Google Scholar]
- Gugliucci, N. E., Taylor, G. B., Peck, A. B., & Giroletti, M. 2005, ApJ, 622, 136 [NASA ADS] [CrossRef] [Google Scholar]
- Gupta, Y., Ajithkumar, B., Kale, H. S., et al. 2017, Curr. Sci., 113, 707 [NASA ADS] [CrossRef] [Google Scholar]
- Guzman, J., Whiting, M., Voronkov, M., et al. 2019, Astrophysics Source Code Library [record ascl:1912.003] [Google Scholar]
- Hada, K., Kino, M., Doi, A., et al. 2013, ApJ, 775, 70 [Google Scholar]
- Hale, C. L., McConnell, D., Thomson, A. J. M., et al. 2021, PASA, 38, e058 [NASA ADS] [CrossRef] [Google Scholar]
- Homan, D. C., Cohen, M. H., Hovatta, T., et al. 2021, ApJ, 923, 67 [NASA ADS] [CrossRef] [Google Scholar]
- Hotan, A. W., Bunton, J. D., Chippendale, A. P., et al. 2021, PASA, 38, e009 [NASA ADS] [CrossRef] [Google Scholar]
- Hovatta, T., Valtaoja, E., Tornikoski, M., & Lähteenmäki, A. 2009, A&A, 494, 527 [CrossRef] [EDP Sciences] [Google Scholar]
- Hurley-Walker, N., Callingham, J. R., Hancock, P. J., et al. 2017, MNRAS, 464, 1146 [Google Scholar]
- Huynh, M., Dempsey, J., Whiting, M. T., & Ophel, M. 2020, in Astronomical Data Analysis Software and Systems XXVII, eds. P. Ballester, J. Ibsen, M. Solar, & K. Shortridge, ASP Conf. Ser., 522, 263 [NASA ADS] [Google Scholar]
- Ighina, L., Belladitta, S., Caccianiga, A., et al. 2021, A&A, 647, L11 [NASA ADS] [CrossRef] [EDP Sciences] [Google Scholar]
- Ighina, L., Moretti, A., Tavecchio, F., et al. 2022, A&A, 659, A93 [NASA ADS] [CrossRef] [EDP Sciences] [Google Scholar]
- Intema, H. T., Jagannathan, P., Mooley, K. P., & Frail, D. A. 2017, A&A, 598, A78 [NASA ADS] [CrossRef] [EDP Sciences] [Google Scholar]
- Jeyakumar, S. 2016, MNRAS, 458, 3786 [NASA ADS] [CrossRef] [Google Scholar]
- Johnston, S., Bailes, M., Bartel, N., et al. 2007, PASA, 24, 174 [NASA ADS] [CrossRef] [Google Scholar]
- Keim, M. A., Callingham, J. R., & Röttgering, H. J. A. 2019, A&A, 628, A56 [NASA ADS] [CrossRef] [EDP Sciences] [Google Scholar]
- Kellermann, K. I., & Pauliny-Toth, I. I. K. 1969, ApJ, 155, L71 [NASA ADS] [CrossRef] [Google Scholar]
- Kellermann, K. I., Sramek, R., Schmidt, M., Shaffer, D. B., & Green, R. 1989, AJ, 98, 1195 [Google Scholar]
- Kim, J. Y., Krichbaum, T. P., Lu, R. S., et al. 2018, A&A, 616, A188 [NASA ADS] [CrossRef] [EDP Sciences] [Google Scholar]
- Lacy, M., Baum, S. A., Chandler, C. J., et al. 2020, PASP, 132, 035001 [Google Scholar]
- Lähteenmäki, A., & Valtaoja, E. 1999, ApJ, 521, 493 [Google Scholar]
- Mauch, T., Murphy, T., Buttery, H. J., et al. 2003, MNRAS, 342, 1117 [Google Scholar]
- Mazzucchelli, C., Bañados, E., Venemans, B. P., et al. 2017, ApJ, 849, 91 [Google Scholar]
- McConnell, D., Hale, C. L., Lenc, E., et al. 2020, PASA, 37 [CrossRef] [Google Scholar]
- McMullin, J. P., Waters, B., Schiebel, D., Young, W., & Golap, K. 2007, in Astronomical Data Analysis Software and Systems XVI, eds. R. A. Shaw, F. Hill, & D. J. Bell, ASP Conf. Ser., 376, 127 [Google Scholar]
- Mertens, F., Lobanov, A. P., Walker, R. C., & Hardee, P. E. 2016, A&A, 595, A54 [NASA ADS] [CrossRef] [EDP Sciences] [Google Scholar]
- Miller-Jones, J. C. A., Gallo, E., Rupen, M. P., et al. 2008, MNRAS, 388, 1751 [NASA ADS] [Google Scholar]
- Momjian, E., Bañados, E., Carilli, C. L., Walter, F., & Mazzucchelli, C. 2021, AJ, 161, 207 [NASA ADS] [CrossRef] [Google Scholar]
- Morabito, L. K., Deller, A. T., Röttgering, H., et al. 2016, MNRAS, 461, 2676 [Google Scholar]
- Murgia, M., Fanti, C., Fanti, R., et al. 1999, A&A, 345, 769 [NASA ADS] [Google Scholar]
- Murphy, T., Mauch, T., Green, A., et al. 2007, MNRAS, 382, 382 [Google Scholar]
- Murphy, T., Kaplan, D. L., Stewart, A. J., et al. 2021, PASA, 38, e054 [NASA ADS] [CrossRef] [Google Scholar]
- Narayan, R. 1992, Philos. Trans. R. Soc. London Ser. A, 341, 151 [NASA ADS] [Google Scholar]
- Norris, R. P., Hopkins, A. M., Afonso, J., et al. 2011, PASA, 28, 215 [Google Scholar]
- Norris, R. P., Marvil, J., Collier, J. D., et al. 2021, PASA, 38, e046 [NASA ADS] [CrossRef] [Google Scholar]
- Nyland, K., Dong, D. Z., Patil, P., et al. 2020, ApJ, 905, 74 [NASA ADS] [CrossRef] [Google Scholar]
- O’Dea, C. P. 1998, PASP, 110, 493 [Google Scholar]
- O’Dea, C. P., & Saikia, D. J. 2021, A&A Rev., 29, 3 [CrossRef] [Google Scholar]
- Oei, M. S. S. L., van Weeren, R. J., Hardcastle, M. J., et al. 2022, A&A, 660, A2 [NASA ADS] [CrossRef] [EDP Sciences] [Google Scholar]
- Orienti, M. 2016, Astron. Nach., 337, 9 [NASA ADS] [CrossRef] [Google Scholar]
- Orienti, M., & Dallacasa, D. 2014, MNRAS, 438, 463 [NASA ADS] [CrossRef] [Google Scholar]
- Padovani, P. 2017, Nat. Astron., 1, 0194 [Google Scholar]
- Pérez-Torres, M., Mattila, S., Alonso-Herrero, A., Aalto, S., & Efstathiou, A. 2021, A&ARv, 29, 2 [CrossRef] [Google Scholar]
- Polatidis, A. G., & Conway, J. E. 2003, PASA, 20, 69 [Google Scholar]
- Polletta, M., Tajer, M., Maraschi, L., et al. 2007, ApJ, 663, 81 [NASA ADS] [CrossRef] [Google Scholar]
- Quici, B., Hurley-Walker, N., Seymour, N., et al. 2021, PASA, 38, e008 [CrossRef] [Google Scholar]
- Rojas-Ruiz, S., Bañados, E., Neeleman, M., et al. 2021, ApJ, 920, 150 [NASA ADS] [CrossRef] [Google Scholar]
- Shao, Y., Wagg, J., Wang, R., et al. 2022, A&A, 659, A159 [NASA ADS] [CrossRef] [EDP Sciences] [Google Scholar]
- Spingola, C., Dallacasa, D., Belladitta, S., et al. 2020, A&A, 643, L12 [EDP Sciences] [Google Scholar]
- Tang, J.-J., Goto, T., Ohyama, Y., et al. 2019, MNRAS, 484, 2575 [NASA ADS] [CrossRef] [Google Scholar]
- Tingay, S. J., Goeke, R., Bowman, J. D., et al. 2013, PASA, 30, e007 [Google Scholar]
- Turner, R. J., Ellingsen, S. P., Shabala, S. S., et al. 2012, ApJ, 754, L19 [NASA ADS] [CrossRef] [Google Scholar]
- Venemans, B. P., Walter, F., Neeleman, M., et al. 2020, ApJ, 904, 130 [Google Scholar]
- Walker, M. A. 1998, MNRAS, 294, 307 [CrossRef] [Google Scholar]
- Wayth, R. B., Lenc, E., Bell, M. E., et al. 2015, PASA, 32, e025 [Google Scholar]
- Wayth, R. B., Tingay, S. J., Trott, C. M., et al. 2018, PASA, 35, 33 [Google Scholar]
- Wilson, W. E., Ferris, R. H., Axtens, P., et al. 2011, MNRAS, 416, 832 [Google Scholar]
- Wootten, A., & Thompson, A. R. 2009, IEEE Proc., 97, 1463 [NASA ADS] [CrossRef] [Google Scholar]
- Wright, E. L., Eisenhardt, P. R. M., Mainzer, A., et al. 2010, AJ, 140, 1868 [NASA ADS] [CrossRef] [Google Scholar]
- Zhang, Y., An, T., & Frey, S. 2020, Sci. Bull., 65, 525 [NASA ADS] [CrossRef] [Google Scholar]
Appendix A: Radio images
In this section we report the radio images of VIK J2318−3113 from the G23 radio surveys (Fig. A.1) and the follow-up and RACS-mid observations (Fig. A.2).
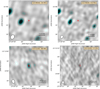 |
Fig. A.1. Radio images of VIK J2318−3113 from the G23 field. In all the images, the radio contours shown in cyan are spaced by |

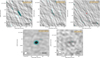 |
Fig. A.2. Same as Fig. A.1, but for the simultaneous follow-up radio observations and the mid-band (1.37 GHz) scan of the RACS survey. |
All Tables
All Figures
|
Fig. 1. Multi-frequency and radio SED of VIK J2318−3113. Left panel: radio-to-optical and UV rest-frame SED of VIK J2318−3113. The solid black line and the dashed blue line are two templates of a QSO and a starbust galaxy from Polletta et al. (2007). Their sum (dashed–dotted magenta line) was normalised to the VIKING–catWISE (orange and brown triangles) and the ALMA (blue squares) data points and then extended in the radio band with a |
| In the text | |
|
Fig. A.1. Radio images of VIK J2318−3113 from the G23 field. In all the images, the radio contours shown in cyan are spaced by |
| In the text | |
|
Fig. A.2. Same as Fig. A.1, but for the simultaneous follow-up radio observations and the mid-band (1.37 GHz) scan of the RACS survey. |
| In the text | |
Current usage metrics show cumulative count of Article Views (full-text article views including HTML views, PDF and ePub downloads, according to the available data) and Abstracts Views on Vision4Press platform.
Data correspond to usage on the plateform after 2015. The current usage metrics is available 48-96 hours after online publication and is updated daily on week days.
Initial download of the metrics may take a while.