Fig. 1.
Download original image
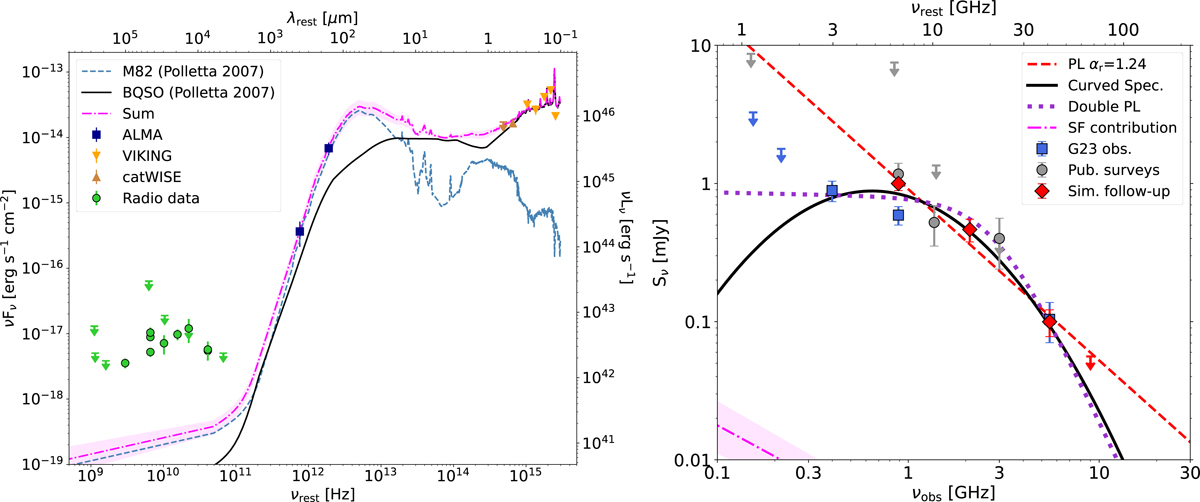
Multi-frequency and radio SED of VIK J2318−3113. Left panel: radio-to-optical and UV rest-frame SED of VIK J2318−3113. The solid black line and the dashed blue line are two templates of a QSO and a starbust galaxy from Polletta et al. (2007). Their sum (dashed–dotted magenta line) was normalised to the VIKING–catWISE (orange and brown triangles) and the ALMA (blue squares) data points and then extended in the radio band with a ![]() power law. The radio data are shown as green points and arrows (when upper limits). Right panel: radio spectrum of VIK J2318−3113, where the different data points are divided according to the project under which they were obtained: G23 (blue squares), simultaneous follow-up (red diamonds), and public surveys (grey circles). The 3σ upper limits are shown as downwards arrows. The dashed red line represents the single power law that best describes the simultaneous detections, αr = 1.24, while the solid black (dotted purple) line is the curved spectrum (double power law) obtained from the fit of all the radio data available with the MrMoorse code (Drouart & Falkendal 2018a). The dashed-dotted magenta line is the expected contribution from SF to the radio emission, as reported in the left panel.
power law. The radio data are shown as green points and arrows (when upper limits). Right panel: radio spectrum of VIK J2318−3113, where the different data points are divided according to the project under which they were obtained: G23 (blue squares), simultaneous follow-up (red diamonds), and public surveys (grey circles). The 3σ upper limits are shown as downwards arrows. The dashed red line represents the single power law that best describes the simultaneous detections, αr = 1.24, while the solid black (dotted purple) line is the curved spectrum (double power law) obtained from the fit of all the radio data available with the MrMoorse code (Drouart & Falkendal 2018a). The dashed-dotted magenta line is the expected contribution from SF to the radio emission, as reported in the left panel.
Current usage metrics show cumulative count of Article Views (full-text article views including HTML views, PDF and ePub downloads, according to the available data) and Abstracts Views on Vision4Press platform.
Data correspond to usage on the plateform after 2015. The current usage metrics is available 48-96 hours after online publication and is updated daily on week days.
Initial download of the metrics may take a while.