Fig. 7
Download original image
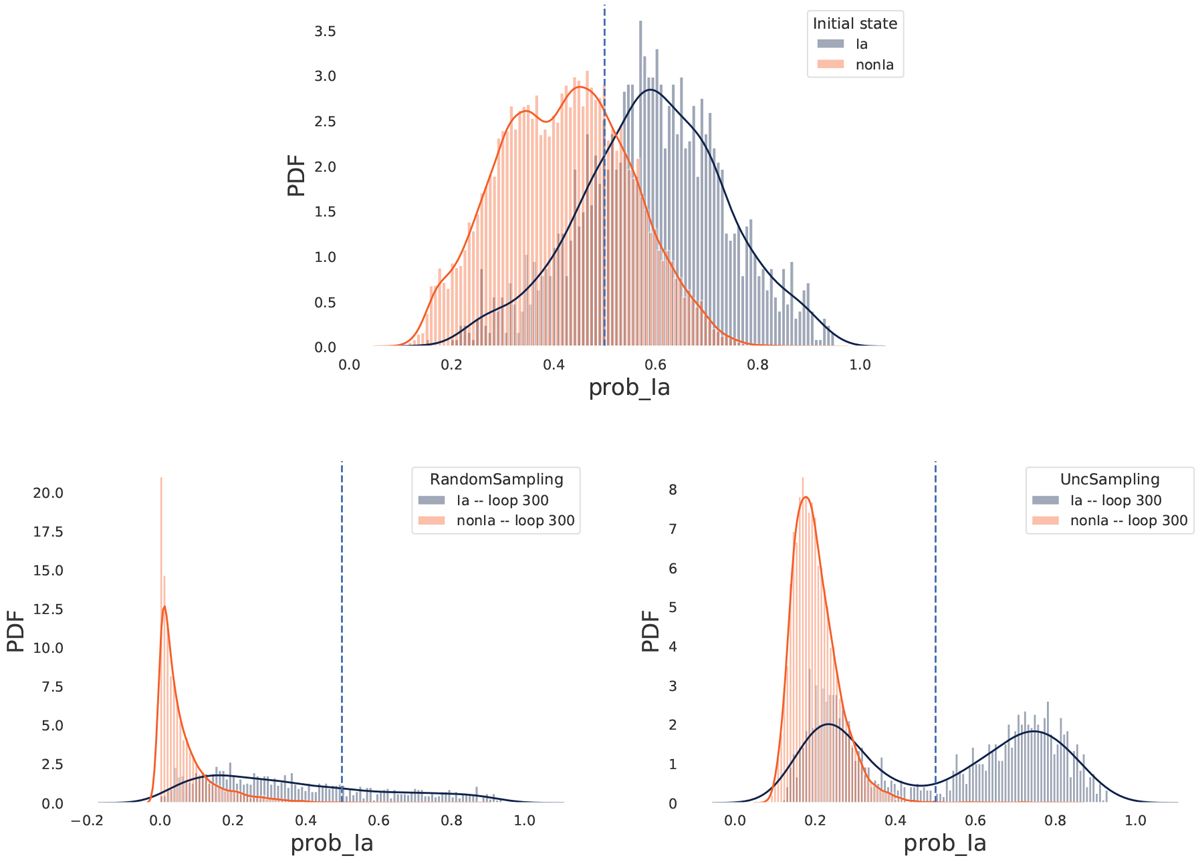
Distribution of classification probabilities in different stages of the learning loop. The top panel shows classification results from the classifier, trained with ten alerts (five SNIa and five randomly selected from other classes). This initial state was allowed to evolve through 300 iterations following different query strategies. Bottom left: results from a training sample built following a random sampling strategy. Bottom right: results from a training sample built following an uncertainty sampling strategy. The vertical dotted line in each panel denotes a 50% probability.
Current usage metrics show cumulative count of Article Views (full-text article views including HTML views, PDF and ePub downloads, according to the available data) and Abstracts Views on Vision4Press platform.
Data correspond to usage on the plateform after 2015. The current usage metrics is available 48-96 hours after online publication and is updated daily on week days.
Initial download of the metrics may take a while.