Fig. 6
Download original image
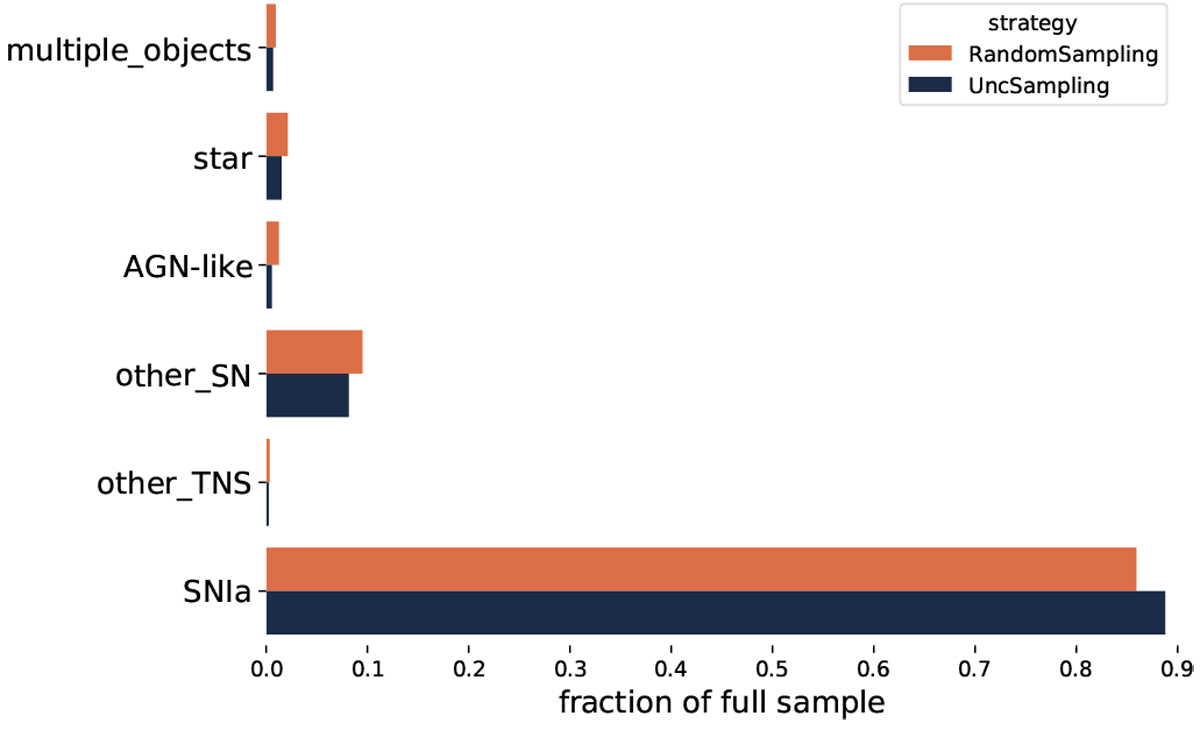
Distribution of true classes among the alerts classified as SN Ia. The classifier was trained using the complete queried sample in addition to the initial training sample (after 300 learning loops) gathered by the random (orange) and uncertainty (blue) sampling strategies. The bar length shows the mean over 100 realizations. Numerical values are given in Table 4.
Current usage metrics show cumulative count of Article Views (full-text article views including HTML views, PDF and ePub downloads, according to the available data) and Abstracts Views on Vision4Press platform.
Data correspond to usage on the plateform after 2015. The current usage metrics is available 48-96 hours after online publication and is updated daily on week days.
Initial download of the metrics may take a while.