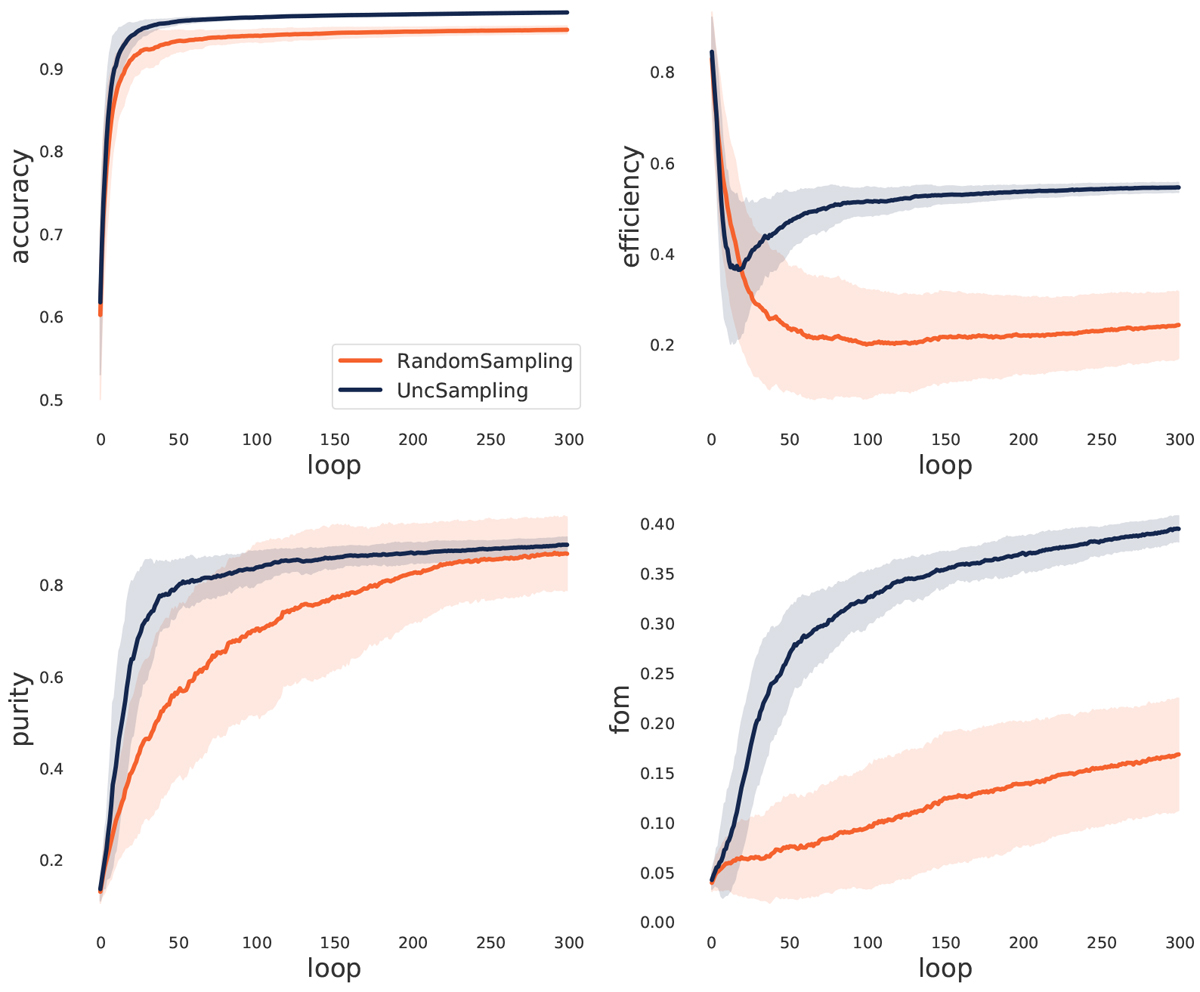
Fig. 4
Download original image
Evolution of classification results as a function of the AL loop. In all panels the orange and blue lines show the results from random and uncertainty sampling, respectively. The dashed regions mark one standard deviation over 100 realizations. The initial training sample in all experiments consisted of ten alerts (five randomly selected from each class) and at each loop only one object was added to the training sample (batch = 1).
Current usage metrics show cumulative count of Article Views (full-text article views including HTML views, PDF and ePub downloads, according to the available data) and Abstracts Views on Vision4Press platform.
Data correspond to usage on the plateform after 2015. The current usage metrics is available 48-96 hours after online publication and is updated daily on week days.
Initial download of the metrics may take a while.