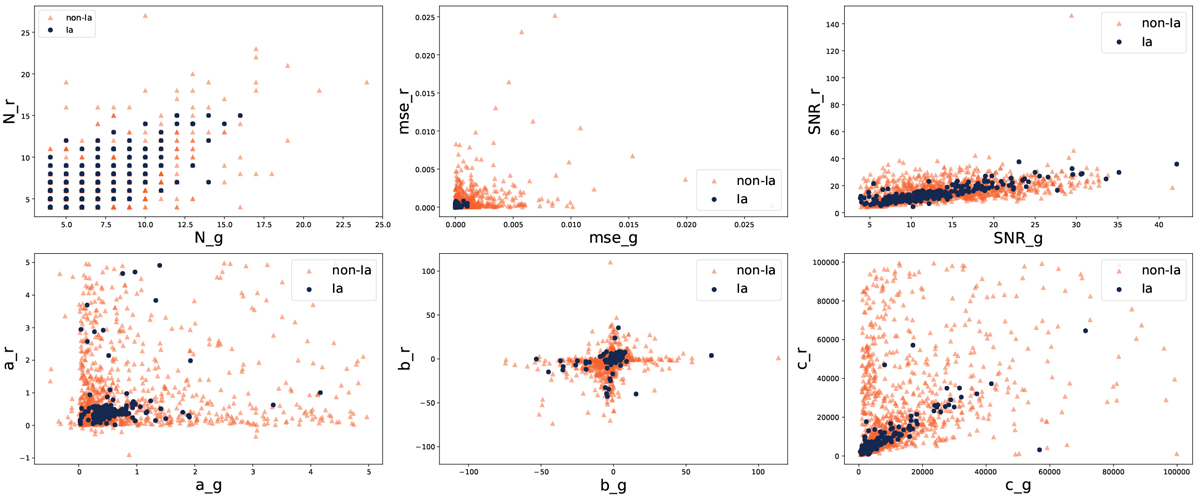
Fig. 3
Download original image
Distribution in feature space according to true alert classes. Each panel shows the same parameter in g and r bands (horizontal and vertical axis, respectively). The blue dots represent alerts from SN Ia sources, while the orange triangles represent all the other classes in our initial data set. We can observe that non-las occupy an overlapping and larger region of the parameter space than their Ia counterparts.
Current usage metrics show cumulative count of Article Views (full-text article views including HTML views, PDF and ePub downloads, according to the available data) and Abstracts Views on Vision4Press platform.
Data correspond to usage on the plateform after 2015. The current usage metrics is available 48-96 hours after online publication and is updated daily on week days.
Initial download of the metrics may take a while.