Fig. 7
Download original image
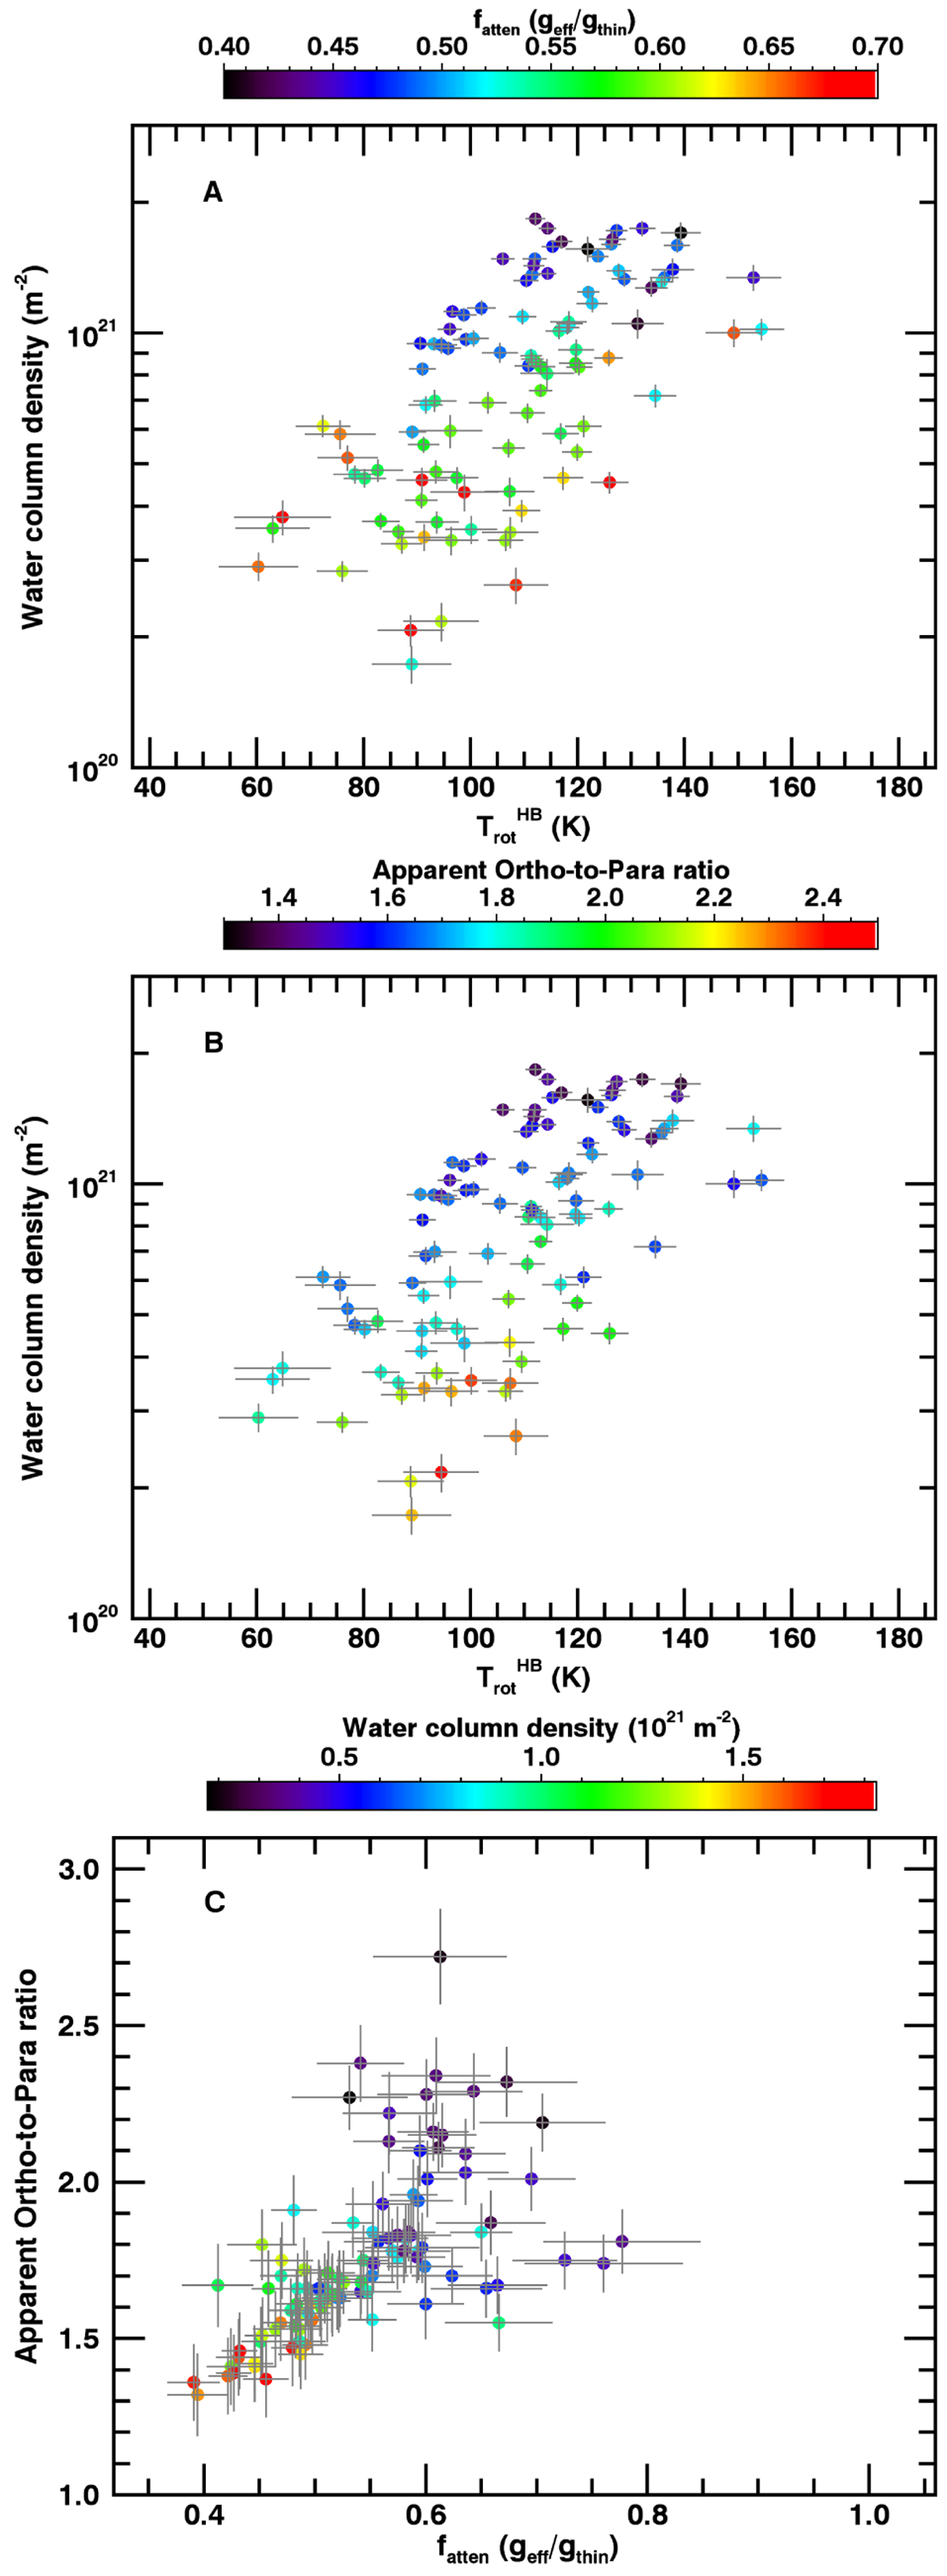
Water column density ![]() , rotational temperature
, rotational temperature ![]() , apparent OPR (from MB fitting), and attenuation factor (fatten) derived from the fitting of VIRTIS-H spectra by optically thin fluorescence spectra. The 102 spectra of dataset S1 are considered. Plots A–C show how these parameters vary with each other. The colour-coding is indicated at the top of each plot.
, apparent OPR (from MB fitting), and attenuation factor (fatten) derived from the fitting of VIRTIS-H spectra by optically thin fluorescence spectra. The 102 spectra of dataset S1 are considered. Plots A–C show how these parameters vary with each other. The colour-coding is indicated at the top of each plot.
Current usage metrics show cumulative count of Article Views (full-text article views including HTML views, PDF and ePub downloads, according to the available data) and Abstracts Views on Vision4Press platform.
Data correspond to usage on the plateform after 2015. The current usage metrics is available 48-96 hours after online publication and is updated daily on week days.
Initial download of the metrics may take a while.