Fig. 4
Download original image
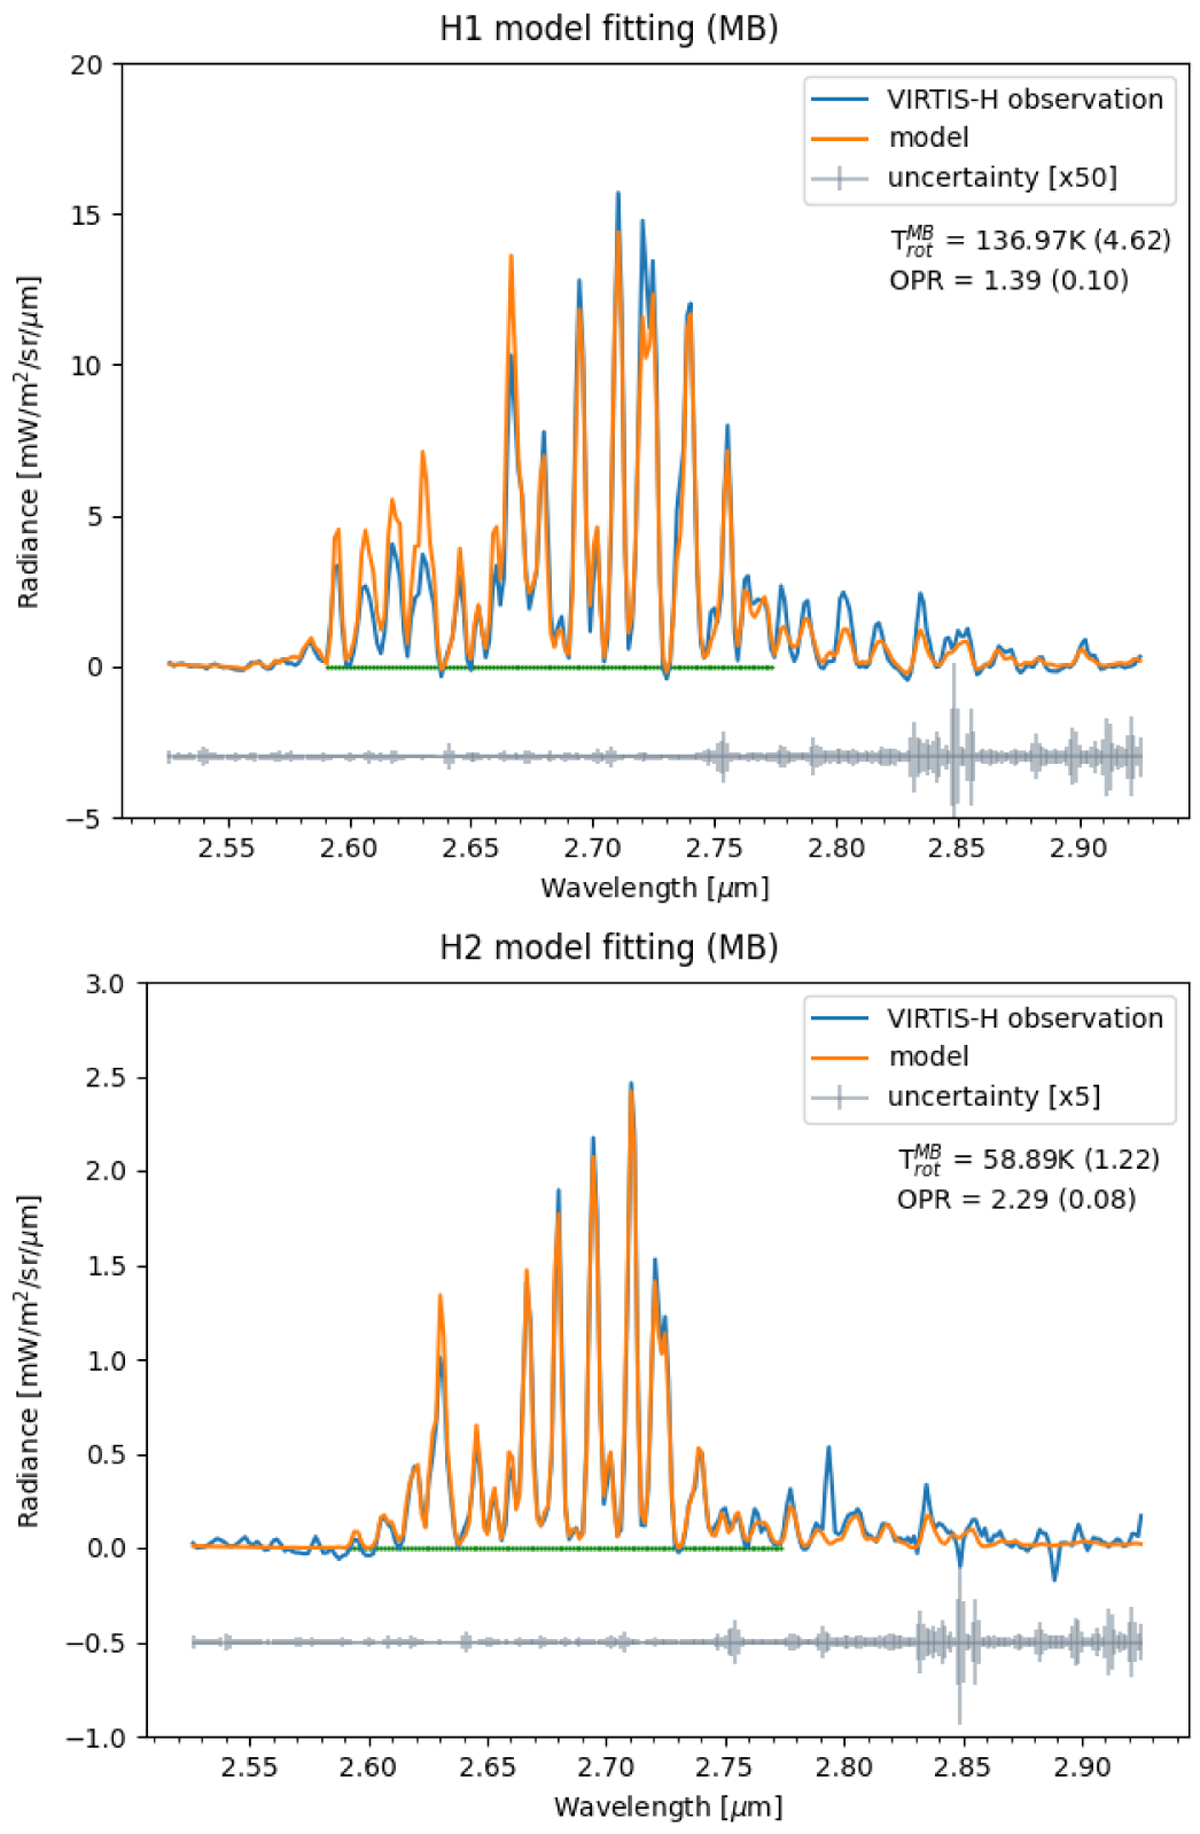
Continuum-subtracted VIRTIS-H spectra (blue) superimposed on the synthetic model that best fits the MB (2.590–2.760 μm) spectral region (orange). Top: H1 dataset. Bottom: H2 dataset. The standard deviation for each spectral channel is shown at the bottom of the plots (and vertically offset with respect to the measured radiances for better clarity). The MB spectral region is shown by a horizontal green line.
Current usage metrics show cumulative count of Article Views (full-text article views including HTML views, PDF and ePub downloads, according to the available data) and Abstracts Views on Vision4Press platform.
Data correspond to usage on the plateform after 2015. The current usage metrics is available 48-96 hours after online publication and is updated daily on week days.
Initial download of the metrics may take a while.