Fig. 3
Download original image
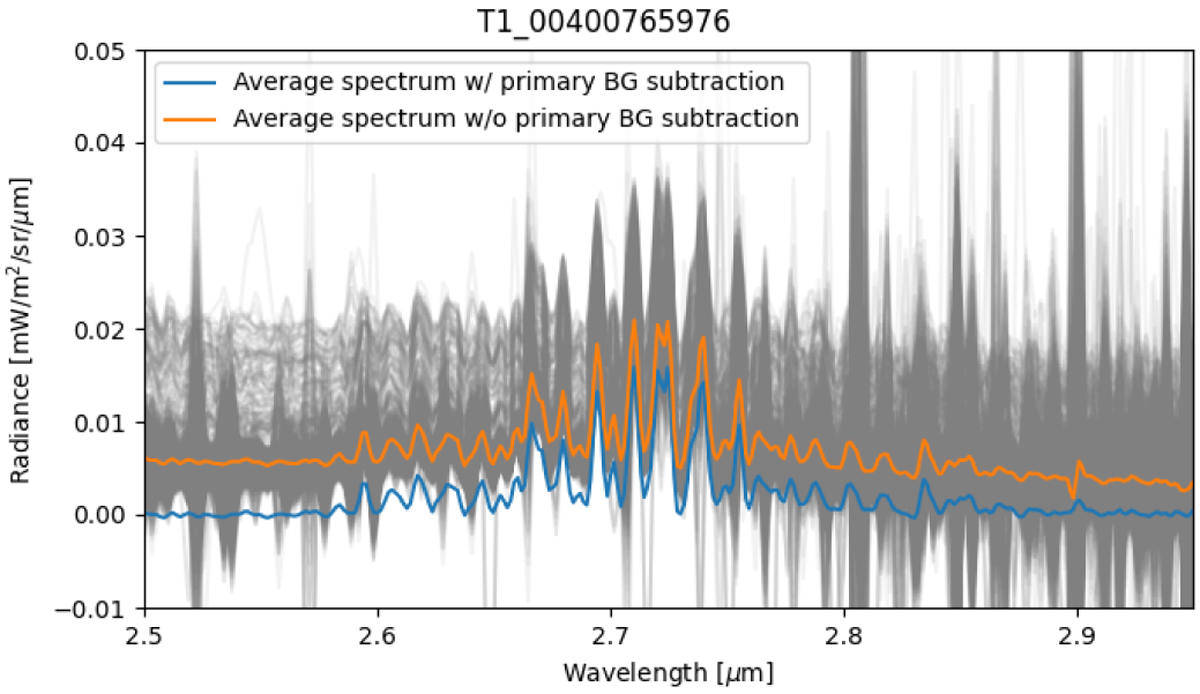
Illustration of data combination and background subtraction. The grey spectra show the 1728 acquisitions of cube T1-00400765976 acquired on 13 September 2015 from 11h:46m:19.3s to 15h:24m:49.8s UT. The orange spectrum is the averaged spectrum, and the blue spectrum is the average spectrum obtained after subtraction of the continuum background, following the method explained in the text. This cube, which shows extreme variations in dust continuum because it was acquired during an outburst (Bockelée-Morvan et al. 2017), was not considered for this paper.
Current usage metrics show cumulative count of Article Views (full-text article views including HTML views, PDF and ePub downloads, according to the available data) and Abstracts Views on Vision4Press platform.
Data correspond to usage on the plateform after 2015. The current usage metrics is available 48-96 hours after online publication and is updated daily on week days.
Initial download of the metrics may take a while.