Fig. 13
Download original image
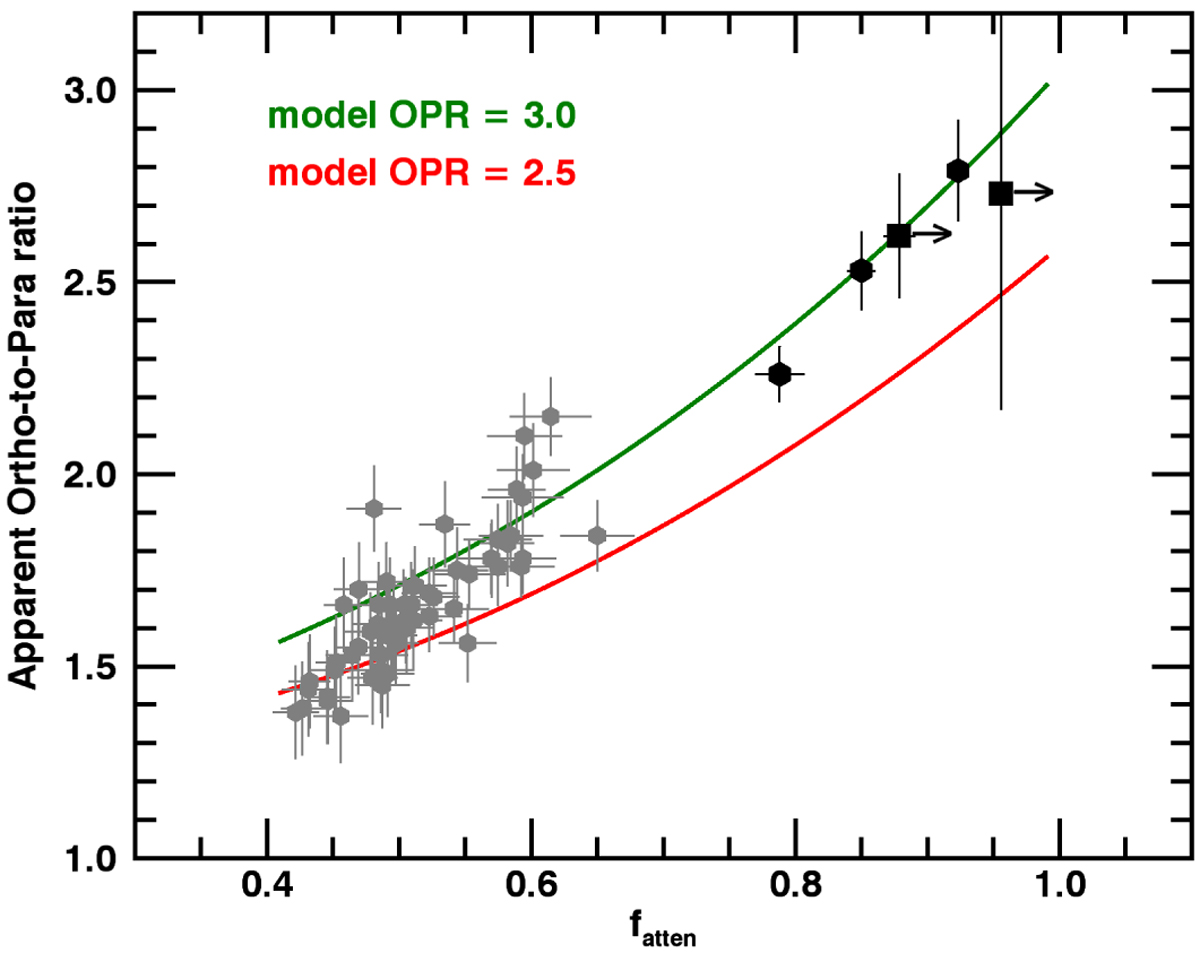
Apparent OPR as a function of the attenuation factor fatten. Results from datasets S1 and S2–S4 are shown as grey and black dots, respectively. Results from datasets H1–H2 are shown by black squares. Only S1 data with an S/N on IHB > 20 are considered. For S2–S4 and H1–H2, the error bars for fatten represent the range of values obtained for f= 2.3 and f= 3. The arrows drawn for H1–H2 indicate a possible underestimation of fatten for these datasets. The curves show the polynomial regressions that fit the OPRRT versus ![]() values shown in Fig. 10C: red and green represent OPR = 2.5 and 3, respectively.
values shown in Fig. 10C: red and green represent OPR = 2.5 and 3, respectively.
Current usage metrics show cumulative count of Article Views (full-text article views including HTML views, PDF and ePub downloads, according to the available data) and Abstracts Views on Vision4Press platform.
Data correspond to usage on the plateform after 2015. The current usage metrics is available 48-96 hours after online publication and is updated daily on week days.
Initial download of the metrics may take a while.