Fig. 12
Download original image
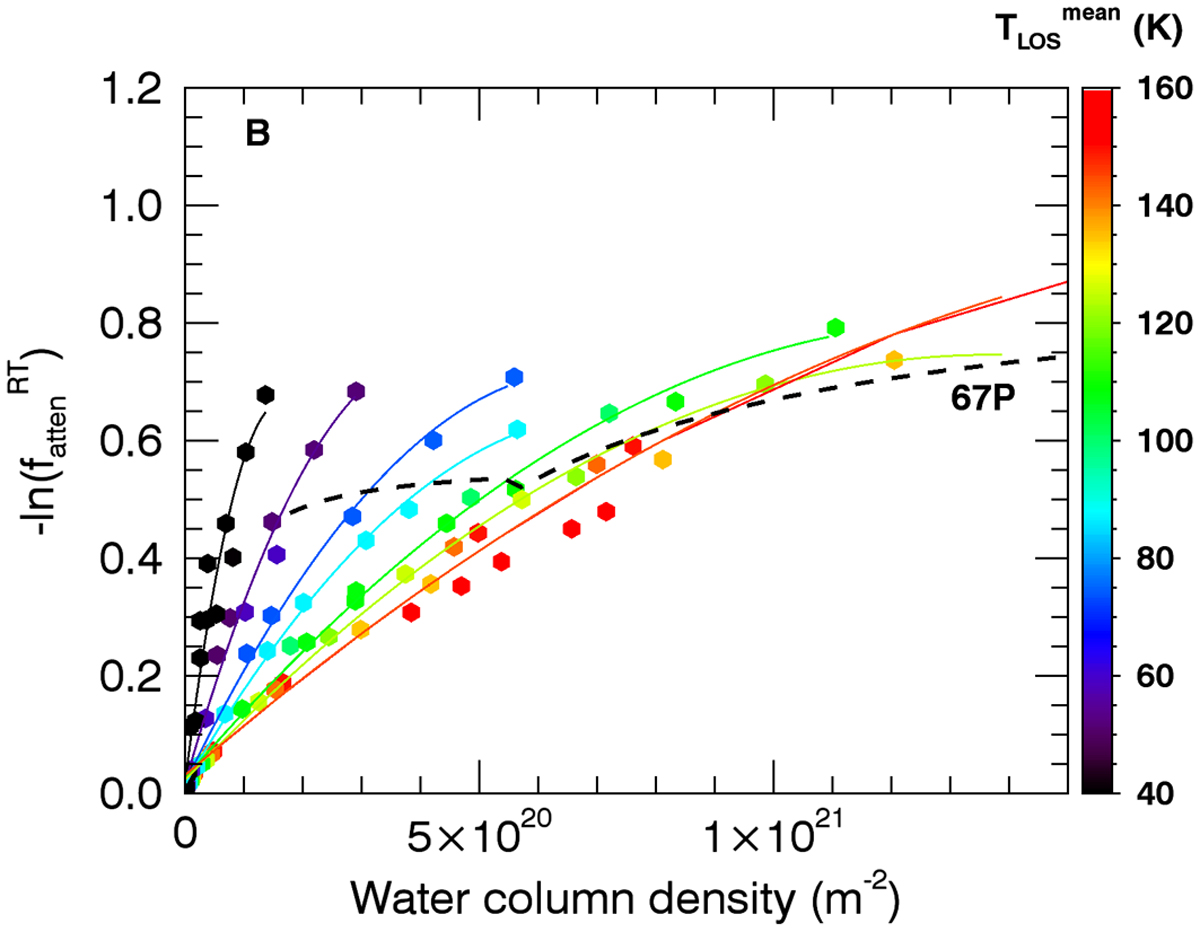
Opacity ![]() as a function of column density (dots). Here, we assume that the radiative transfer model underestimates the opacity effects, and a factor of f = 2.3 is applied (see text), so that the values correspond to the red dots plotted in Fig. 11. Colour-coding is according to the LOS mean temperature
as a function of column density (dots). Here, we assume that the radiative transfer model underestimates the opacity effects, and a factor of f = 2.3 is applied (see text), so that the values correspond to the red dots plotted in Fig. 11. Colour-coding is according to the LOS mean temperature ![]() , and the colour scale is given at the right. A polynomial fitting of degree 2 is shown for various temperatures (35, 55, 70, 80, 100, 120, and 140 K). The dashed line corresponds to the two-line fit of
, and the colour scale is given at the right. A polynomial fitting of degree 2 is shown for various temperatures (35, 55, 70, 80, 100, 120, and 140 K). The dashed line corresponds to the two-line fit of ![]() values from dataset S1 shown in Fig. 11.
values from dataset S1 shown in Fig. 11.
Current usage metrics show cumulative count of Article Views (full-text article views including HTML views, PDF and ePub downloads, according to the available data) and Abstracts Views on Vision4Press platform.
Data correspond to usage on the plateform after 2015. The current usage metrics is available 48-96 hours after online publication and is updated daily on week days.
Initial download of the metrics may take a while.