Fig. 11
Download original image
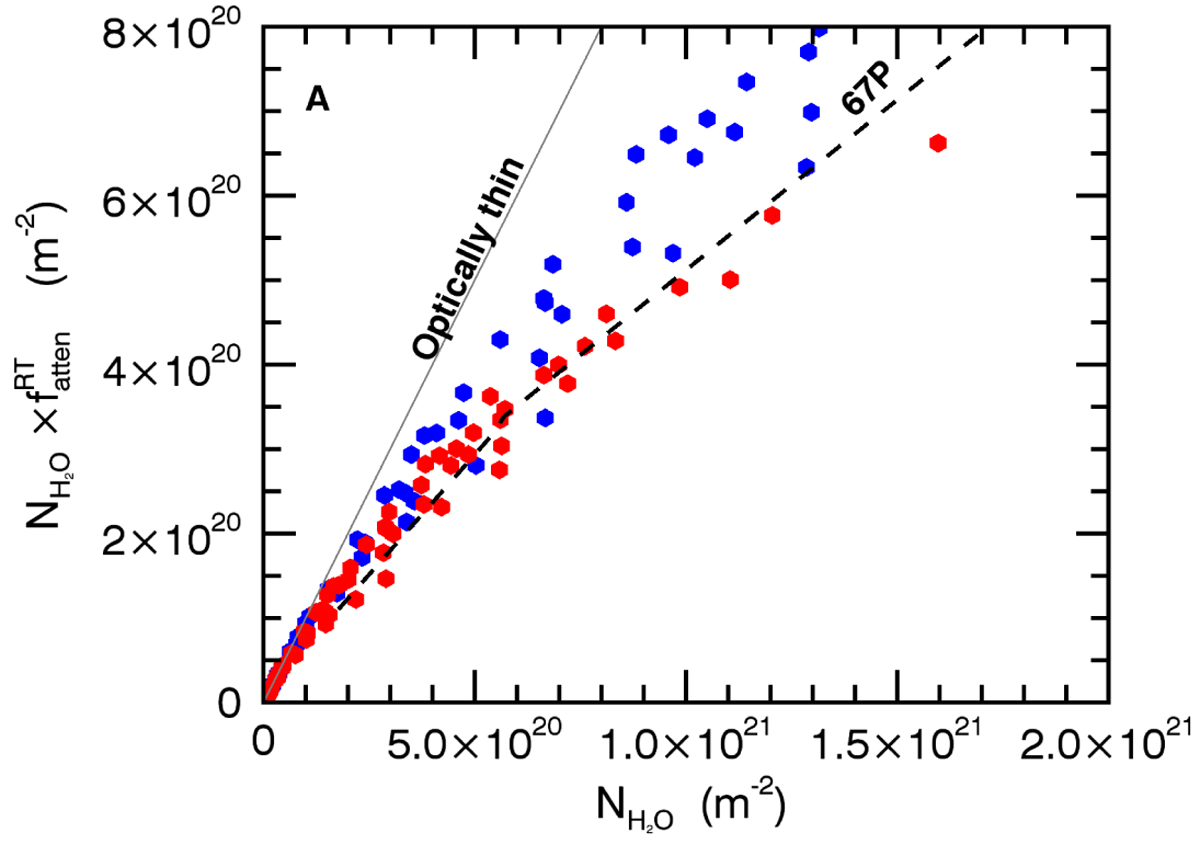
Direct comparison of optical depth effects derived from model and observations. The column density (blue dots) obtained by fitting the synthetic RT spectra ![]() is plotted as a function of the effective column density
is plotted as a function of the effective column density ![]() . The values plotted as red dots are obtained by considering that the radiative transfer model underestimates the opacity effects by a factor f = 2.3 (see text). The dashed line shows the two-line fit of
. The values plotted as red dots are obtained by considering that the radiative transfer model underestimates the opacity effects by a factor f = 2.3 (see text). The dashed line shows the two-line fit of ![]() values from dataset S1 (see text). The plain line shows optically thin conditions.
values from dataset S1 (see text). The plain line shows optically thin conditions.
Current usage metrics show cumulative count of Article Views (full-text article views including HTML views, PDF and ePub downloads, according to the available data) and Abstracts Views on Vision4Press platform.
Data correspond to usage on the plateform after 2015. The current usage metrics is available 48-96 hours after online publication and is updated daily on week days.
Initial download of the metrics may take a while.