Fig. 10
Download original image
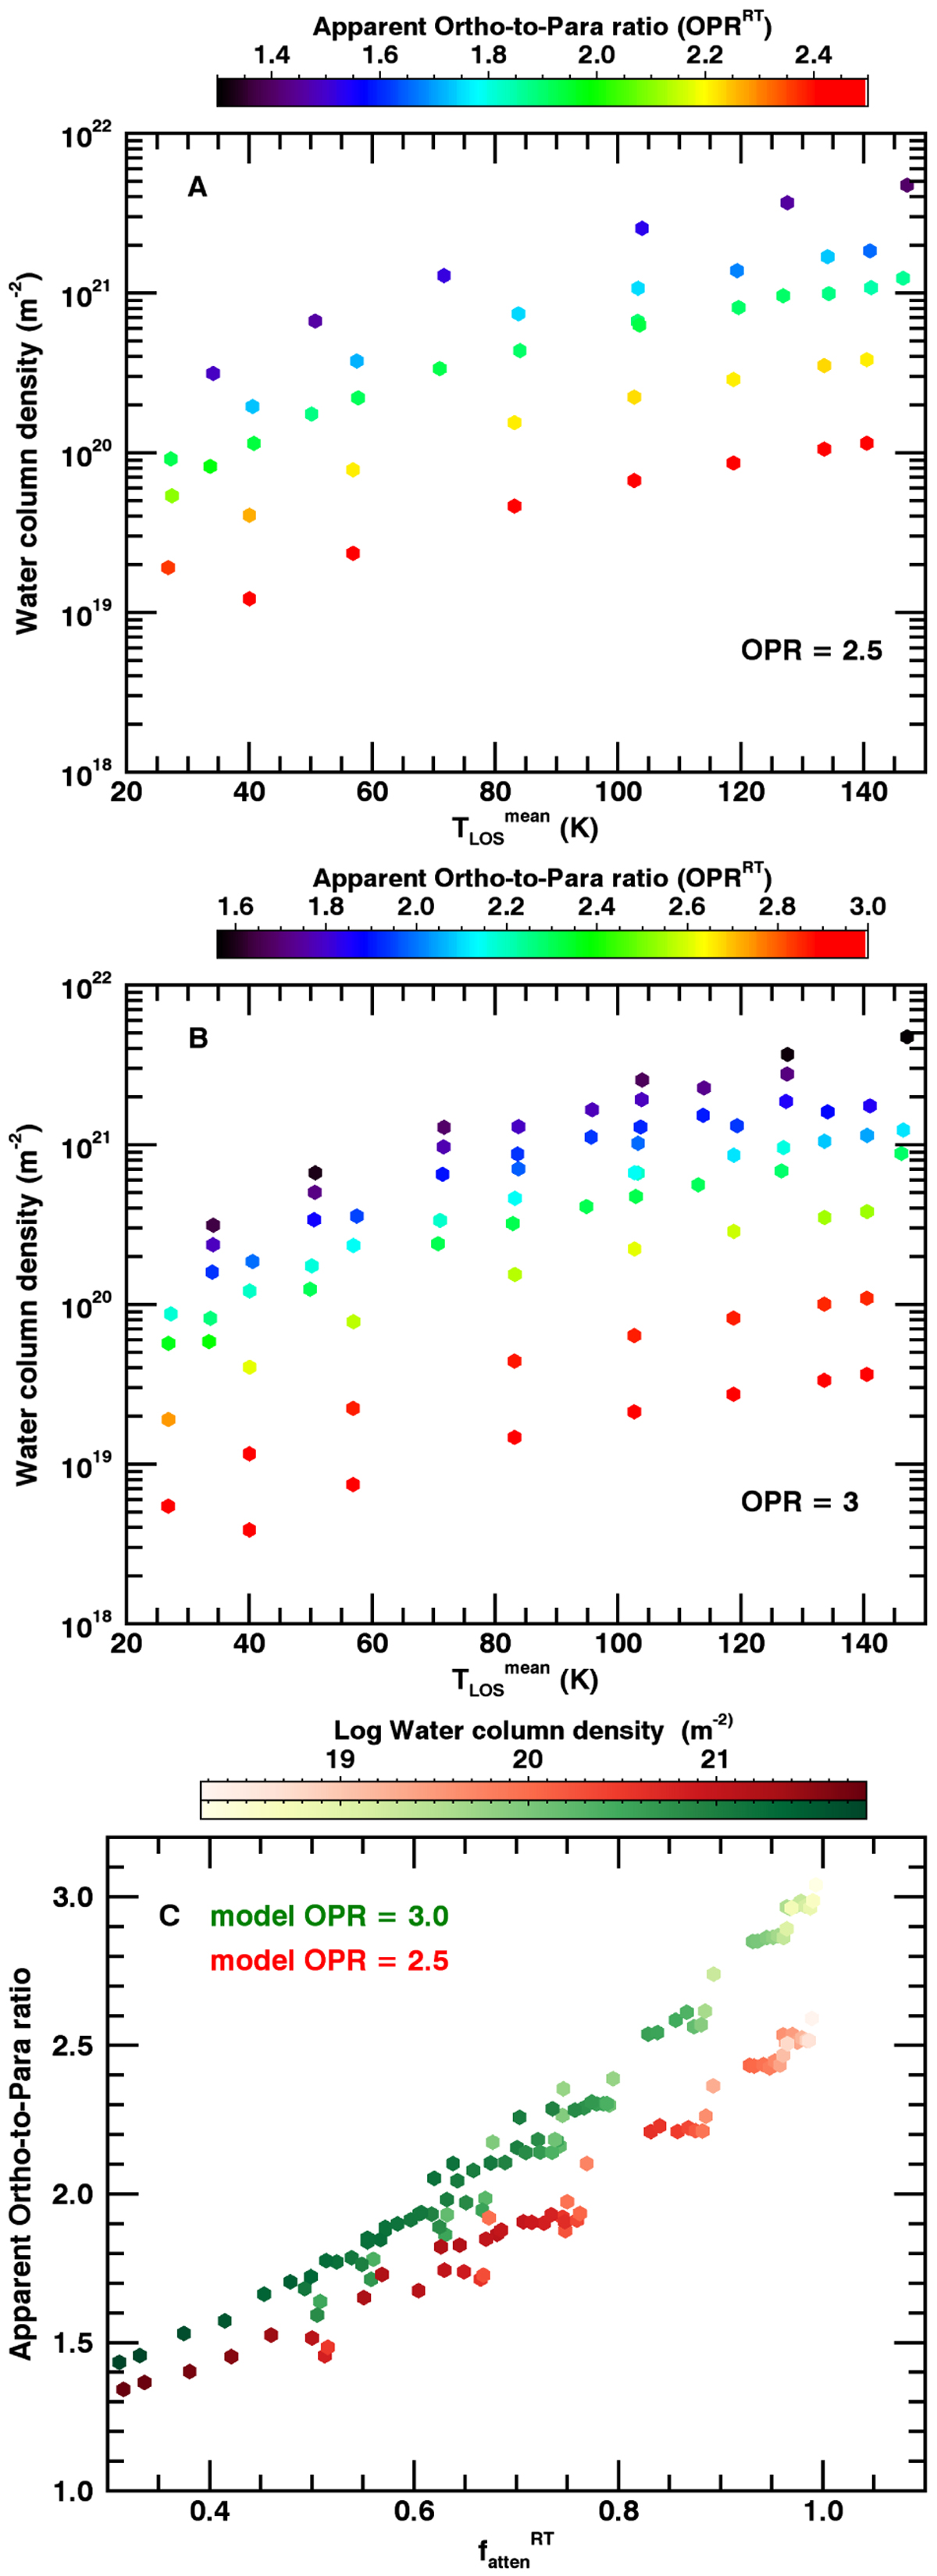
Results from radiative transfer calculations. Apparent OPR as a function of LOS mean temperature ![]() and column density (A, B), and as a function of the attenuation factor (C). Plots A and B refer to calculations with an effective OPR of 2.5 and 3, respectively, with a colour-coding according to the derived apparent OPR. For C plot, the colour-coding is according to the column density (in base-10 log scale).
and column density (A, B), and as a function of the attenuation factor (C). Plots A and B refer to calculations with an effective OPR of 2.5 and 3, respectively, with a colour-coding according to the derived apparent OPR. For C plot, the colour-coding is according to the column density (in base-10 log scale).
Current usage metrics show cumulative count of Article Views (full-text article views including HTML views, PDF and ePub downloads, according to the available data) and Abstracts Views on Vision4Press platform.
Data correspond to usage on the plateform after 2015. The current usage metrics is available 48-96 hours after online publication and is updated daily on week days.
Initial download of the metrics may take a while.