Fig. 1
Download original image
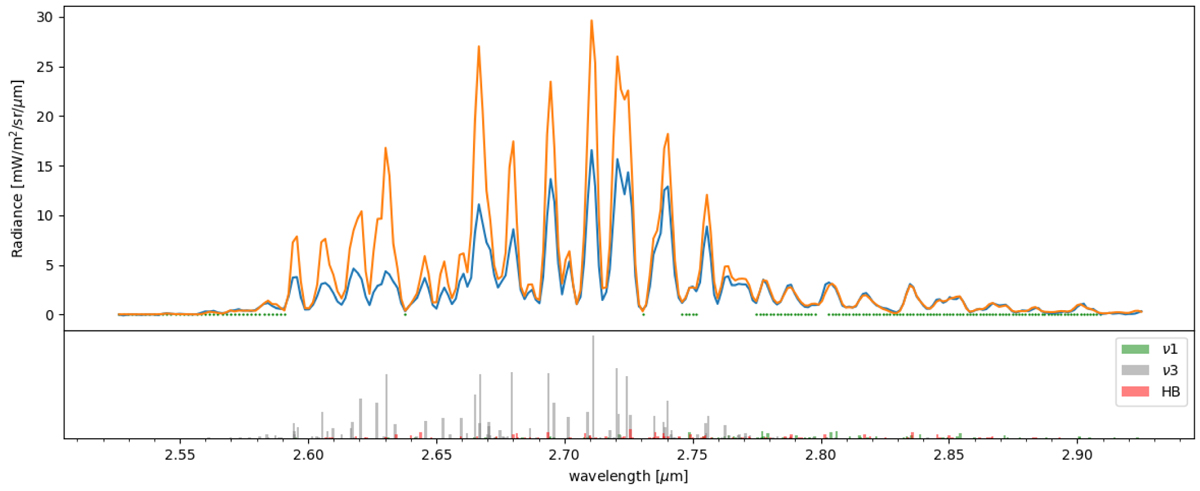
Continuum-subtracted VIRTIS-H spectrum of dataset H1 (blue curve) superimposed on the synthetic model that best fits the HB (2.774–2.910 μm) spectral region (orange curve). Dataset H1 is the weighted average of 22 data cubes obtained near perihelion (see Sect. 3.5.3 and Table 1 for geometric parameters and fitted parameters). The spectral range used to fit the HB region is indicated with a dotted green line. The bottom panel shows a synthetic optically thin spectrum at Trot = 116 K, with different colours for the v1 (green), v3 (grey), and hot bands (red).
Current usage metrics show cumulative count of Article Views (full-text article views including HTML views, PDF and ePub downloads, according to the available data) and Abstracts Views on Vision4Press platform.
Data correspond to usage on the plateform after 2015. The current usage metrics is available 48-96 hours after online publication and is updated daily on week days.
Initial download of the metrics may take a while.