Open Access
Fig. 8.
Download original image
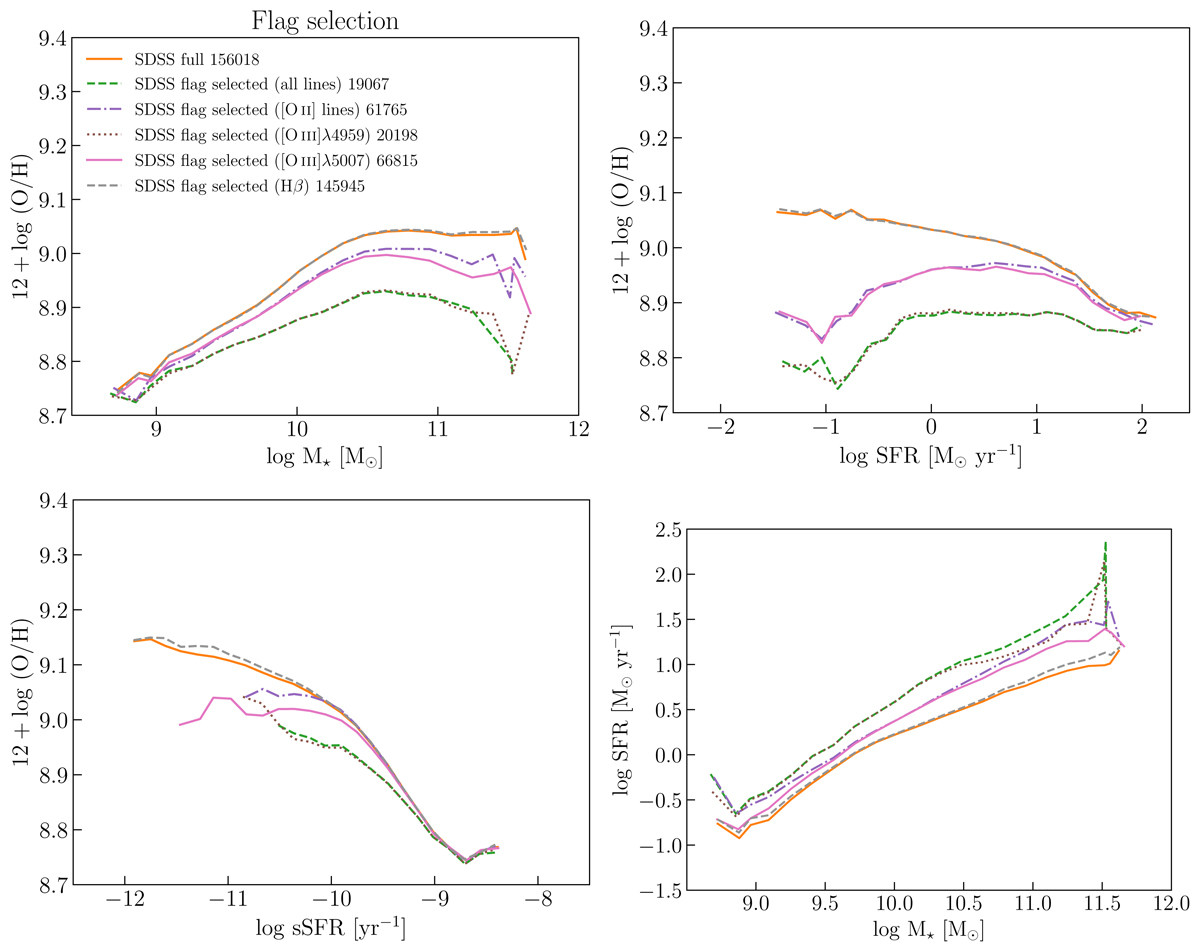
Effects of the selection on t-value flag for the emission lines (orange solid line: full sample; green dashed line: all lines; purple dash-dotted line: [O II]; brown dotted line: [O III]λ4959; pink solid line: [O III]λ5007; grey dashed line: Hβ) on the projections for SDSS sample.
Current usage metrics show cumulative count of Article Views (full-text article views including HTML views, PDF and ePub downloads, according to the available data) and Abstracts Views on Vision4Press platform.
Data correspond to usage on the plateform after 2015. The current usage metrics is available 48-96 hours after online publication and is updated daily on week days.
Initial download of the metrics may take a while.