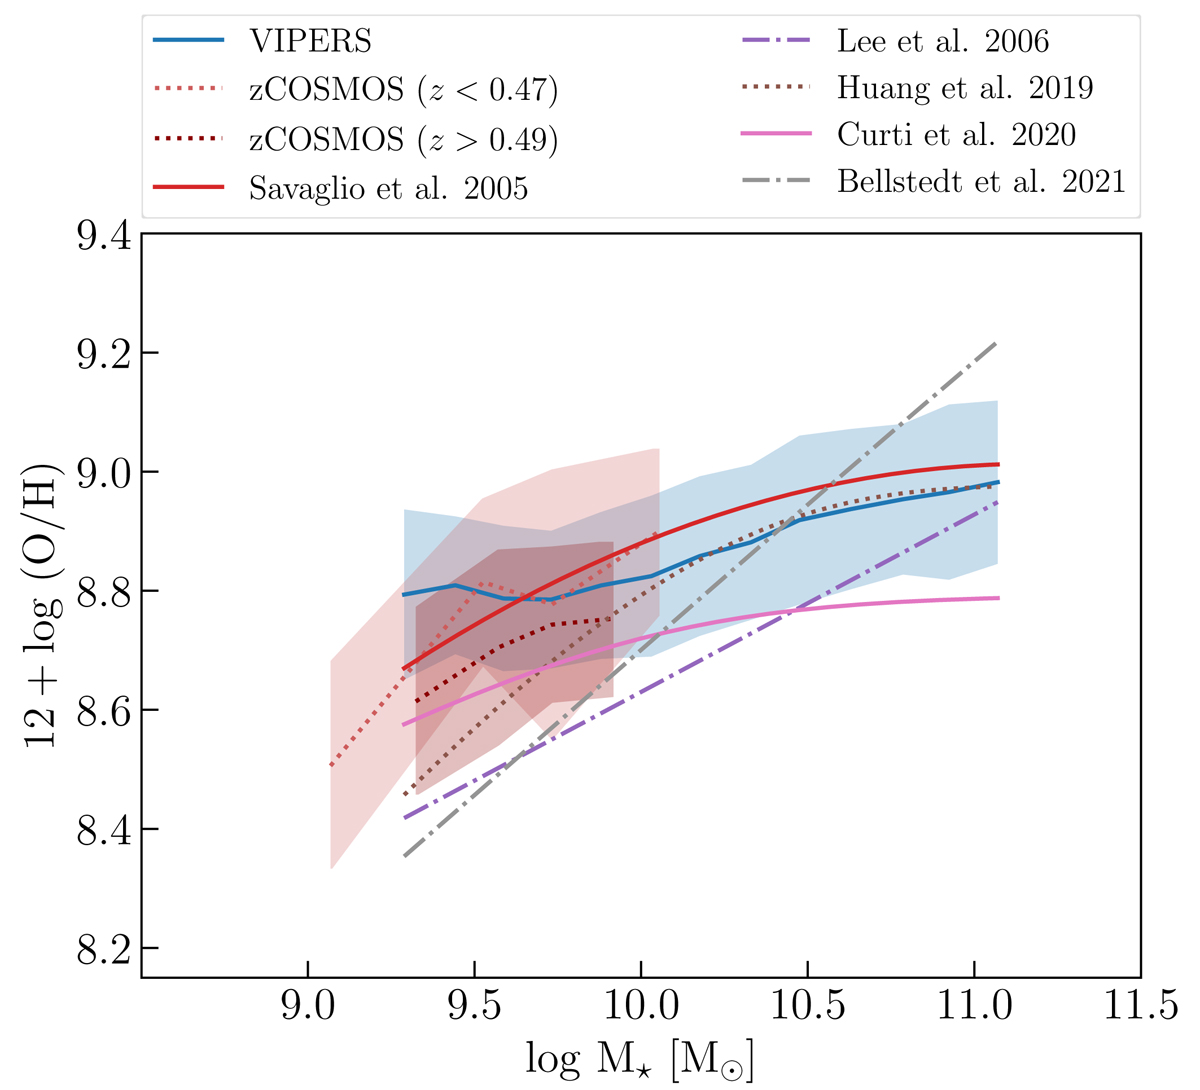
Fig. 15.
Download original image
Comparison between MZR of the VIPERS sample (blue solid line) and the relations from the literature (red solid line by Savaglio et al. 2005; purple dash-dotted line by Lee et al. 2006; and brown dotted line by Huang et al. 2019; pink solid line by Bellstedt et al. 2021). In the same plot, we report the zCOSMOS data (red dotted lines) for both redshift bin from Cresci et al. (2012).
Current usage metrics show cumulative count of Article Views (full-text article views including HTML views, PDF and ePub downloads, according to the available data) and Abstracts Views on Vision4Press platform.
Data correspond to usage on the plateform after 2015. The current usage metrics is available 48-96 hours after online publication and is updated daily on week days.
Initial download of the metrics may take a while.