Fig. 5
Download original image
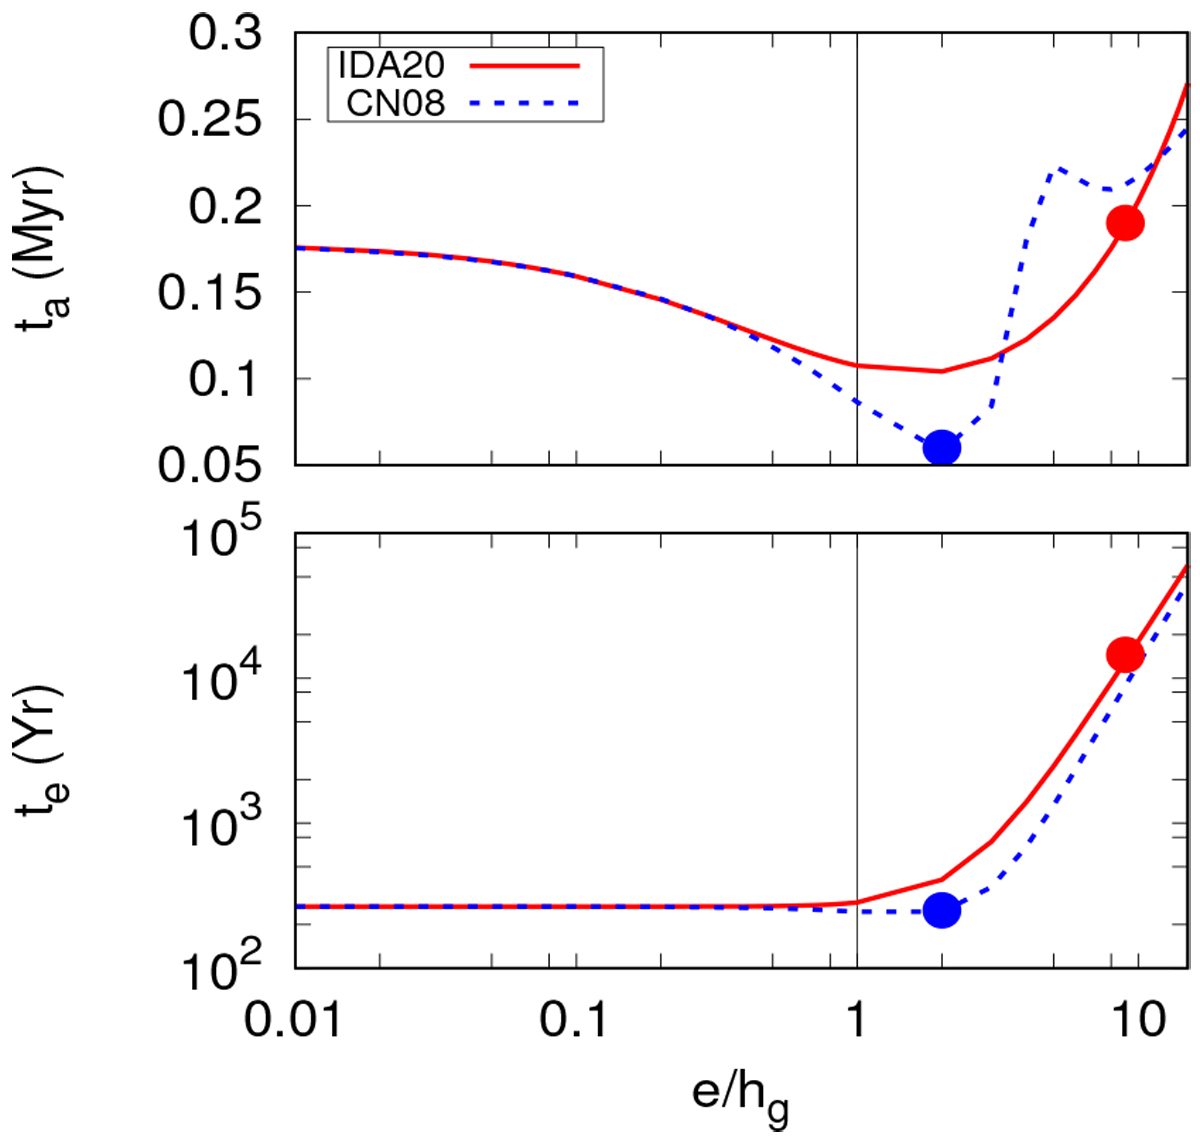
Semimajor axis migration timescales ta (top panel) and eccentricity damping timescales te (bottom panel) as a function of e/hg. The red and blue lines indicates the prescriptions from IDA20 and CN08, respectively. Both cases consider an inner planet with mass MMars located at a = 0.02 au. The red dot indicates e = 0.2 from the IDA20 prescription, and the blue dot shows e = 0.05 from CN08. The solid black line represents the limit between subsonic and supersonic regime.
Current usage metrics show cumulative count of Article Views (full-text article views including HTML views, PDF and ePub downloads, according to the available data) and Abstracts Views on Vision4Press platform.
Data correspond to usage on the plateform after 2015. The current usage metrics is available 48-96 hours after online publication and is updated daily on week days.
Initial download of the metrics may take a while.