Fig. 14
Download original image
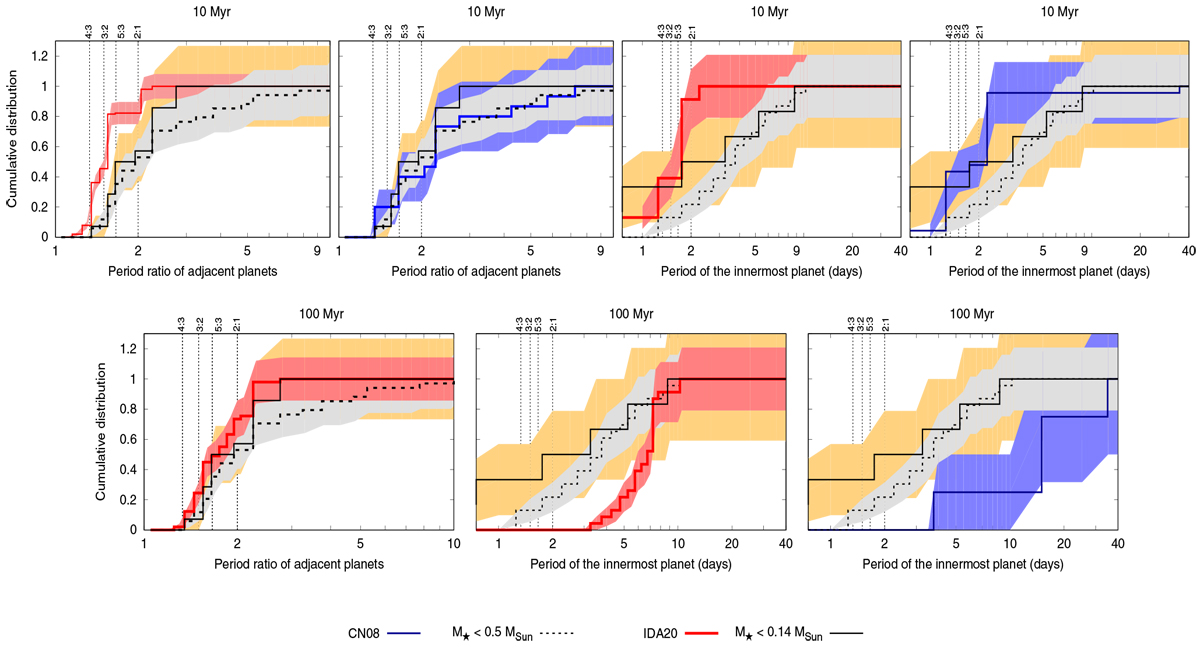
Comparison of cumulative distributions of survival planets in the IDA20 (red line) and CN08 (blue line) simulations at 10 Myr (top panels) and at 100 Myr (bottom panels), and the confirmed Earth-like planets around stars with 0.08 < M⋆/M⊙ < 0.14 M⊙ (solid black line) and 0.14 < M⋆/M⊙ < 0.5 M⊙ (dotted black line). All planets are located at a < 0.1 au. The color shadows correspond to the Poissonian errors in IDA20 (red), CN08 (blue) and confirmed exoplanets around M⋆ < 0.14 M⊙ (orange) and M⋆ < 0.5 M⊙ (gray).
Current usage metrics show cumulative count of Article Views (full-text article views including HTML views, PDF and ePub downloads, according to the available data) and Abstracts Views on Vision4Press platform.
Data correspond to usage on the plateform after 2015. The current usage metrics is available 48-96 hours after online publication and is updated daily on week days.
Initial download of the metrics may take a while.