| Issue |
A&A
Volume 663, July 2022
|
|
|---|---|---|
| Article Number | C1 | |
| Number of page(s) | 2 | |
| Section | Letters to the Editor | |
| DOI | https://doi.org/10.1051/0004-6361/202142281e | |
| Published online | 01 July 2022 | |
Letter to the Editor
The width of Herschel filaments varies with distance (Corrigendum)
1
California Institute of Technology, Mail Code 350-17, 1200 E. California Blvd, Pasadena, CA 91125, USA
e-mail: This email address is being protected from spambots. You need JavaScript enabled to view it.
2
Department of Physics, Stanford University, Stanford, California 94305, USA
3
Kavli Institute for Particle Astrophysics & Cosmology, PO Box 2450 Stanford University, Stanford, CA 94305, USA
4
Department of Astrophysics, University of Vienna, Türkenschanzstrasse 17, 1180 Vienna, Austria
5
Department of Physics & Astronomy, University of North Carolina, Chapel Hill, North Carolina 27599, USA
6
Chalmers University of Technology, Department of Space, Earth and Environment, 412 93 Gothenburg, Sweden
7
Scuola Normale Superiore di Pisa, Piazza dei Cavalieri, 7, 56126 Pisa, Italy
8
University of Cologne, I. Physical Institute, Zülpicher Str. 77, 50937 Cologne, Germany
9
Jodrell Bank Centre for Astrophysics, Department of Physics and Astronomy, University of Manchester, Oxford Road, Manchester M13 9PL, UK
Key words: ISM: clouds / ISM: structure / stars: formation / local insterstellar matter / errata, addenda
The erratum concerns Figs. 2 and B.2. in the original publication (Panopoulou et al. 2022). While the convolution described in Appendix B was done correctly, with beam sizes corresponding to the different selected distances, a mistake was found when converting the resulting radial profiles from angular to physical units. This last conversion was done assuming the distances of 260 pc, 423 pc and 762 pc, which led to an artificial ‘stretching’ of the radial axis. We have now corrected this error, by assuming the original distance of 140 pc when converting the radial profile to units of pc. Figures 2 and B.2 have been updated and are shown here. We thank Philippe André for pointing out this error.
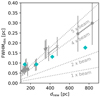 |
Fig. 1. Corrected points for the Taurus filament shown with blue diamonds. |
The error does not change the main findings and conclusions of the paper, regarding the observed dependence of the previously measured distributions of filament widths with distance. The convergence study shows that resolution likely affects the width measurements of filaments in far away clouds. As pointed out in Sect. 3, far away clouds are responsible for increasing the all-cloud-ensemble mean width to 0.1 pc. We have shown that this mean value is not a representative statistic for each cloud in the sample, calling for a re-evaluation of the conclusions of previous Herschel studies.
As the resulting dependence on resolution is milder than originally found in the convergence test, the text requires minor modifications to reflect this. In the abstract, the text should be modified to state: ‘We find that resolution can affect the shapes of radial profiles over the observed range of distances’, where we have removed the word ‘severely’ from the original sentence.
The discussion of Fig. 2 in paragraphs 3 and 4 of Sect. 4 should refer to a factor of ∼2 rise in the FWHMobs of the Taurus filament profile (shown with blue symbols in the updated Fig. 2 presented here), instead of the factor of 10 previously noted. The rise described in the text for the Taurus filament is not as steep as that of the per-cloud mean widths, but remains significant. At the largest distance considered, the Taurus filament has a width of 0.18 pc.
In the conclusions, the text should be modified to reflect the fact that the resolution study reveals a modest, but measurable, effect (softening the language from ‘severe’) and that the per-cloud mean widths rise more steeply than the test of the Taurus filament, indicating that more work is needed to understand the effects of resolution on the ensemble properties of filaments.
Finally, the corrected Fig. B.2 is shown here. The text of Appendix B should note when discussing Fig. B.2 that the profiles only slightly broaden with increasing beam size. The values of rout found via the derivative method are now consistent with 0.3 pc for all distances considered. The two ways of determining rout yield identical widths (this was not the case for the largest distance in the original paper, where a 40% difference was quoted). The last paragraph should note the difference of up to a factor of 2 (not 10) from the initial FWHMobs when discussing the limitations of the ‘deconvolved’ equation for the widths.
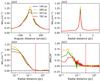 |
Fig. 2. Figure B.2. Corrected median radial profiles at different resolutions. |
References
- Panopoulou, G. V., Clark, S. E., Hacar, A., et al. 2022, A&A, 657, L13 [NASA ADS] [CrossRef] [EDP Sciences] [Google Scholar]
© G. V. Panopoulou et al. 2022
 Open Access article, published by EDP Sciences, under the terms of the Creative Commons Attribution License (https://creativecommons.org/licenses/by/4.0), which permits unrestricted use, distribution, and reproduction in any medium, provided the original work is properly cited.
This article is published in open access under the Subscribe-to-Open model. This email address is being protected from spambots. You need JavaScript enabled to view it. to support open access publication.
All Figures
|
Fig. 1. Corrected points for the Taurus filament shown with blue diamonds. |
| In the text | |
|
Fig. 2. Figure B.2. Corrected median radial profiles at different resolutions. |
| In the text | |
Current usage metrics show cumulative count of Article Views (full-text article views including HTML views, PDF and ePub downloads, according to the available data) and Abstracts Views on Vision4Press platform.
Data correspond to usage on the plateform after 2015. The current usage metrics is available 48-96 hours after online publication and is updated daily on week days.
Initial download of the metrics may take a while.