Fig. 5.
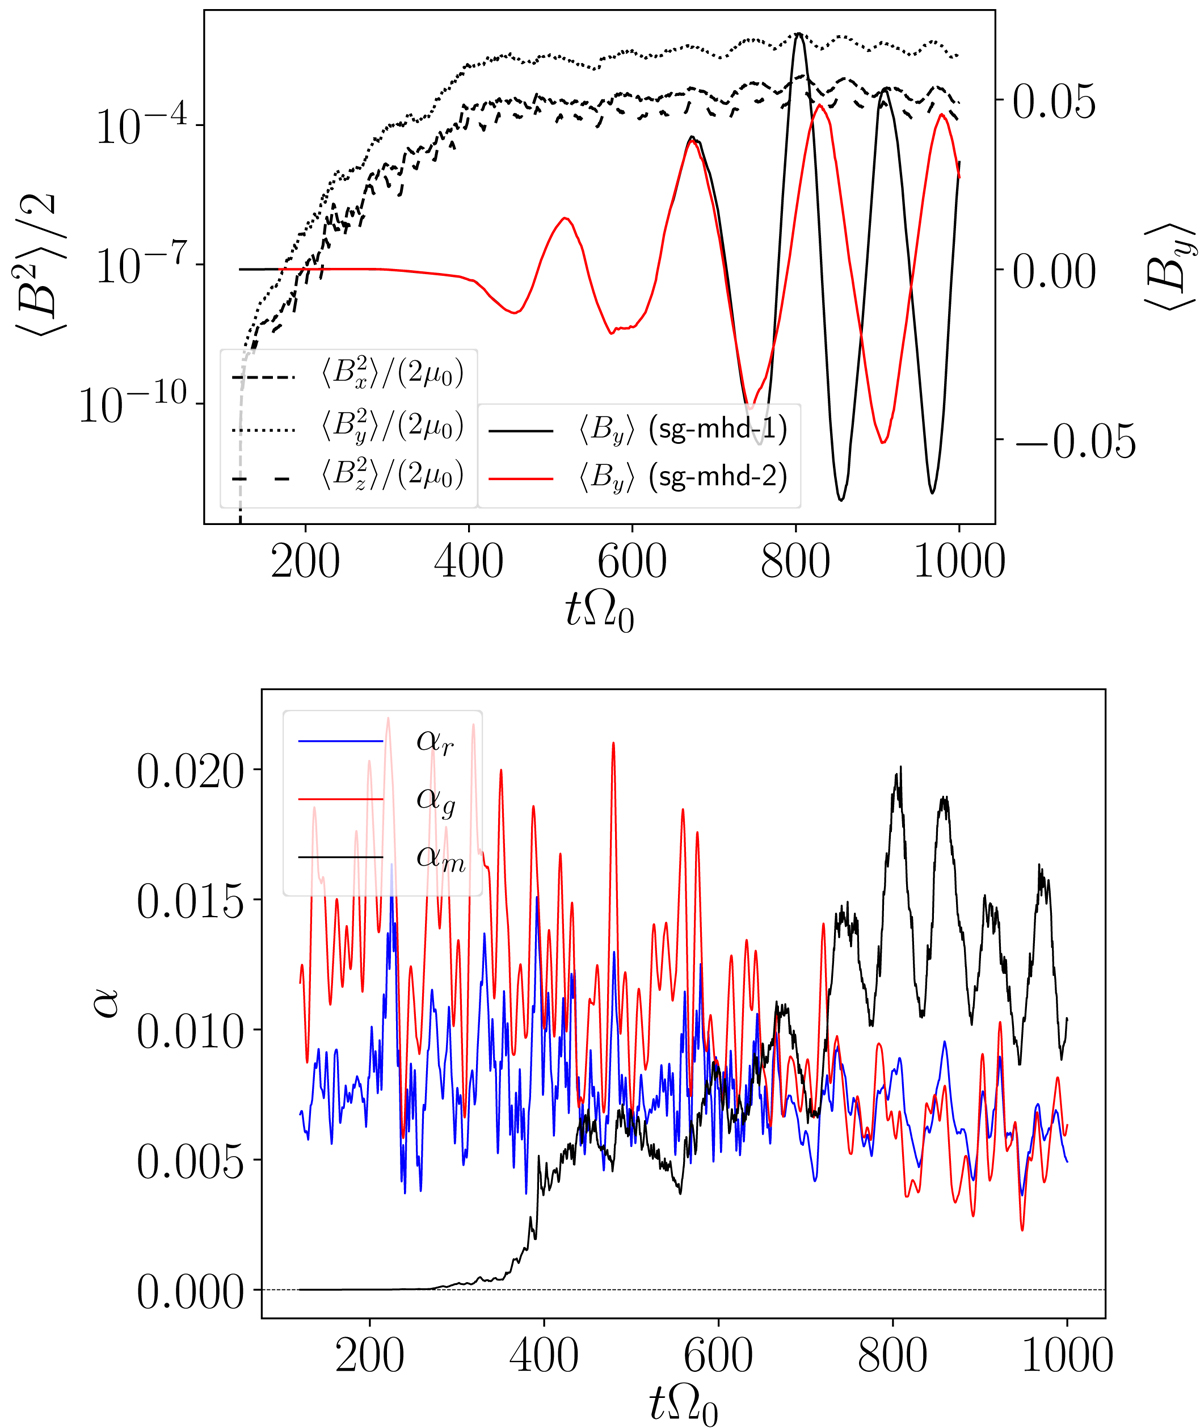
Download original image
Time evolution for a selection of volume-averaged quantities, whereby the first image shows quantities related to the magnetic field and the second image depicts the turbulent stresses. First image: left axis, dashed and dotted lines: box-averaged magnetic energy densities for Bx, By, and Bz. Right axis, solid lines: box-averaged toroidal field component ⟨By⟩ for simulations sg-mhd-1(black) and sg-mhd-2(red). Simulation sg-mhd-2 is discussed in the last paragraph of this section. Second image: turbulent stresses normalised by pressure sorted for αr (Reynolds), αg (gravity), and αm (Maxwell). The stresses (αr, αg) are smoothed using a Gaussian convolute (standard deviation ![]() ).
).
Current usage metrics show cumulative count of Article Views (full-text article views including HTML views, PDF and ePub downloads, according to the available data) and Abstracts Views on Vision4Press platform.
Data correspond to usage on the plateform after 2015. The current usage metrics is available 48-96 hours after online publication and is updated daily on week days.
Initial download of the metrics may take a while.