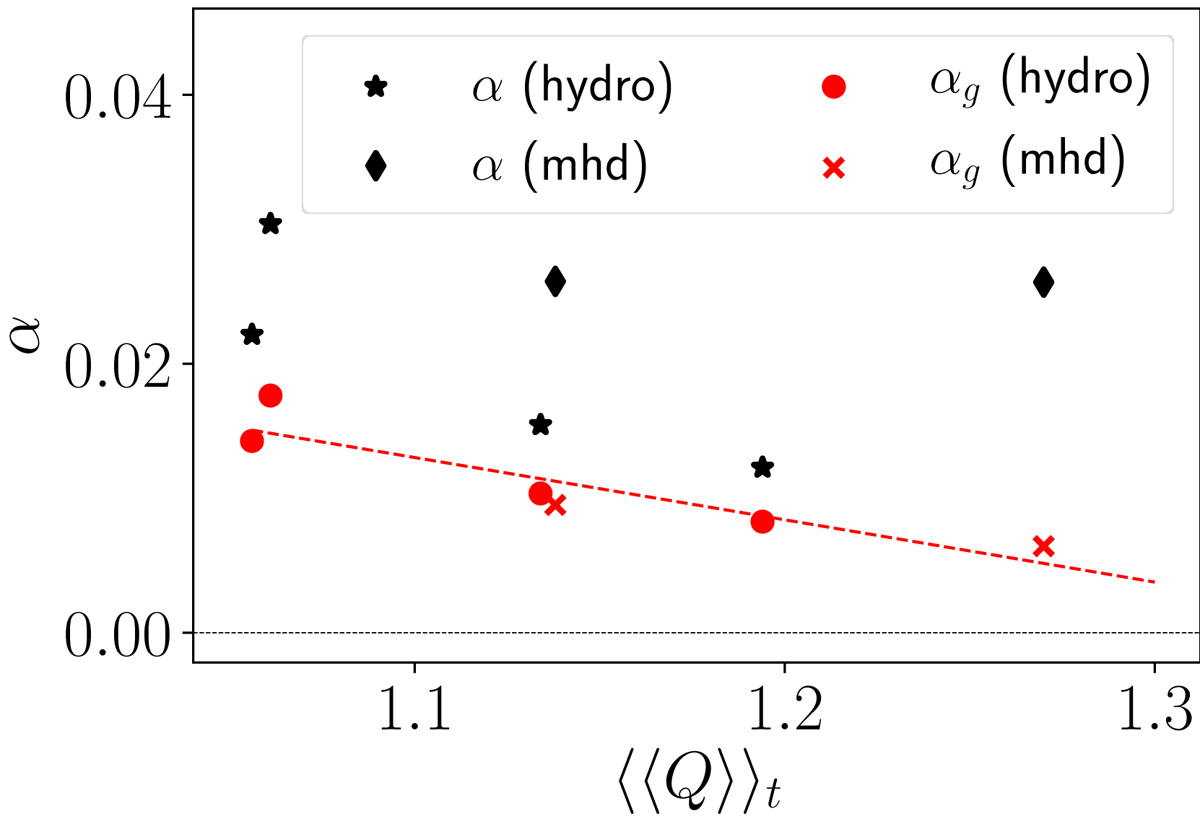
Fig. 4.
Download original image
Time-averaged dimensionless turbulent stresses (Eqs. (8) and (9)) as function of the volume and time-averaged Toomre parameter ⟨⟨Q⟩⟩t. Each data point corresponds to one simulation. The black stars show the sum total of Reynolds and gravitational stress α = αr + αg for the hydrodynamical simulations (GI058, GI072, GI087, GI095). The corresponding contributions from the gravitational stress αg are hown as red dots. Depicted as black diamonds and red crosses are α and αg for the MHD simulations sg-mhd-1 and sg-mhd-2 (discussed in the following sections). In MHD cases, one has α = αr + αg + αm, with Maxwell contribution αm. The red dashed line is a guide to the eye (linear fit) for the trend in αg.
Current usage metrics show cumulative count of Article Views (full-text article views including HTML views, PDF and ePub downloads, according to the available data) and Abstracts Views on Vision4Press platform.
Data correspond to usage on the plateform after 2015. The current usage metrics is available 48-96 hours after online publication and is updated daily on week days.
Initial download of the metrics may take a while.