Free Access
Fig. 2.
Download original image
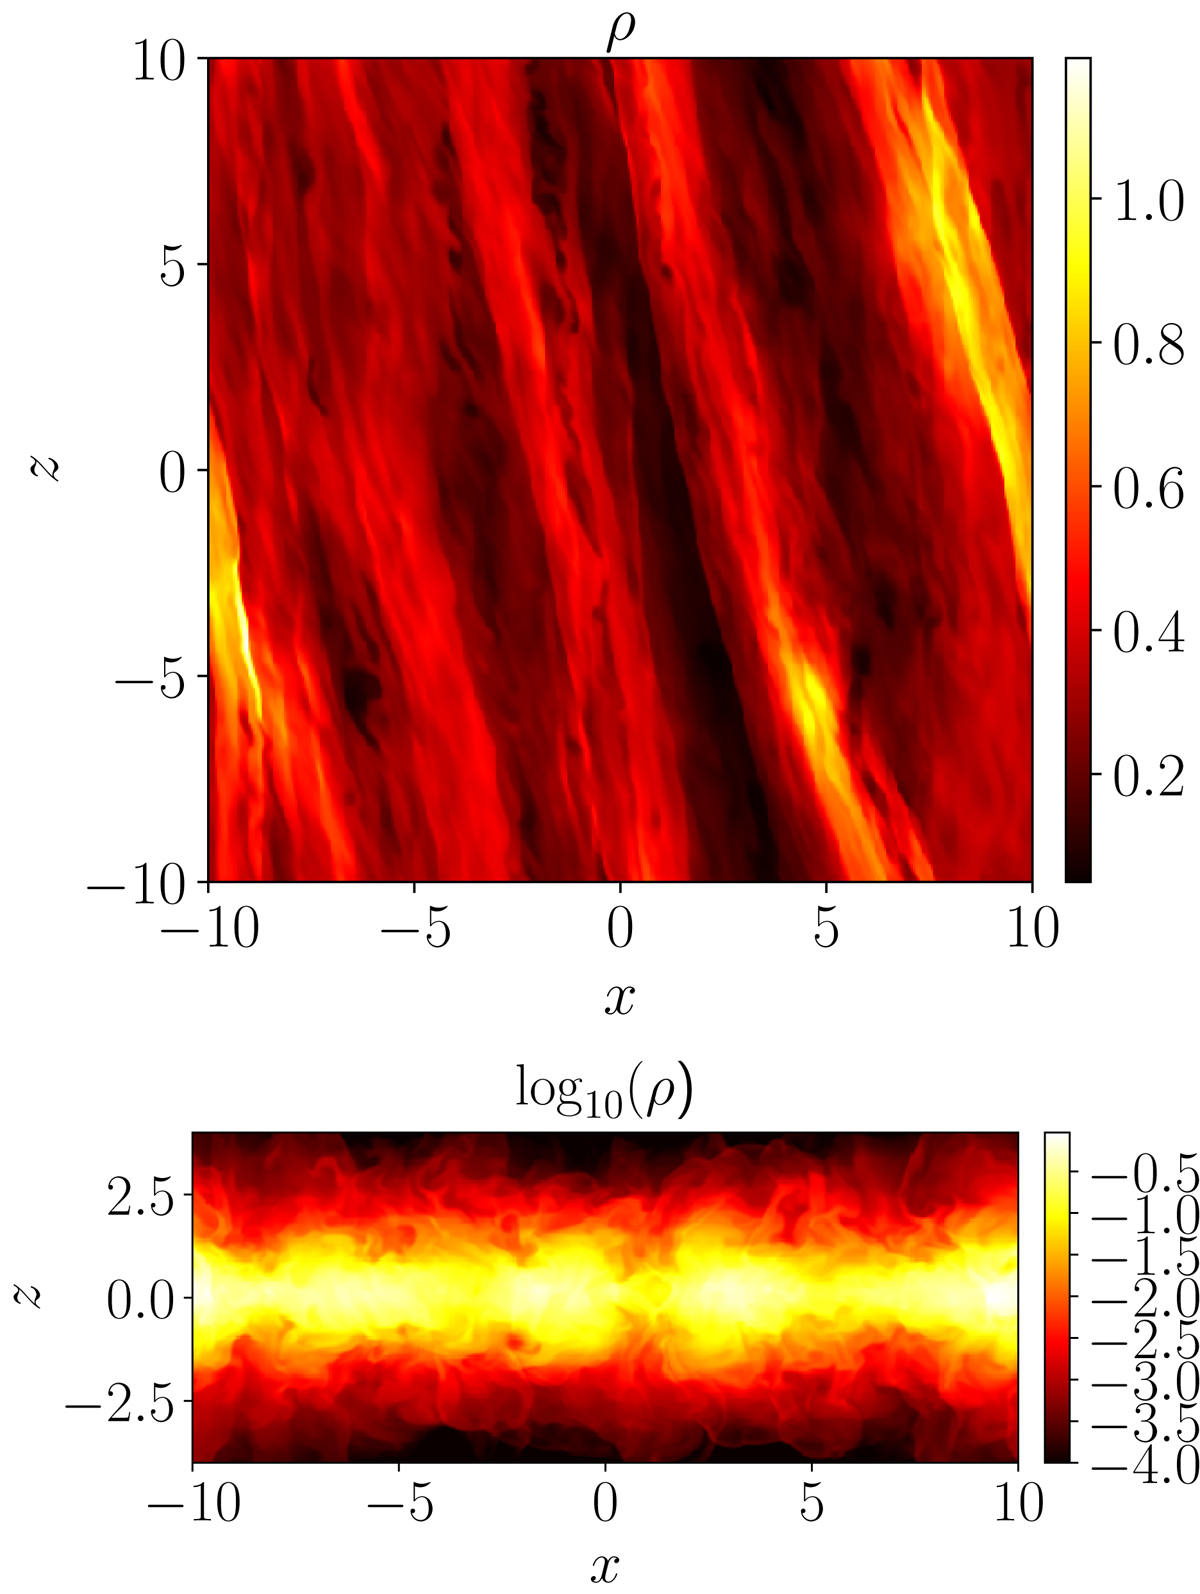
Mass-density slices for GI072 in fully developed turbulence, ![]() after restart. First image: horizontal slice ρ(x, y, z = 0). Second image: vertical slice log10(ρ)(x, y = 0, z). The logarithm is used in the bottom image as the latter provides a more convenient visual guide for the vertical density profile.
after restart. First image: horizontal slice ρ(x, y, z = 0). Second image: vertical slice log10(ρ)(x, y = 0, z). The logarithm is used in the bottom image as the latter provides a more convenient visual guide for the vertical density profile.
Current usage metrics show cumulative count of Article Views (full-text article views including HTML views, PDF and ePub downloads, according to the available data) and Abstracts Views on Vision4Press platform.
Data correspond to usage on the plateform after 2015. The current usage metrics is available 48-96 hours after online publication and is updated daily on week days.
Initial download of the metrics may take a while.