Fig. 8.
Download original image
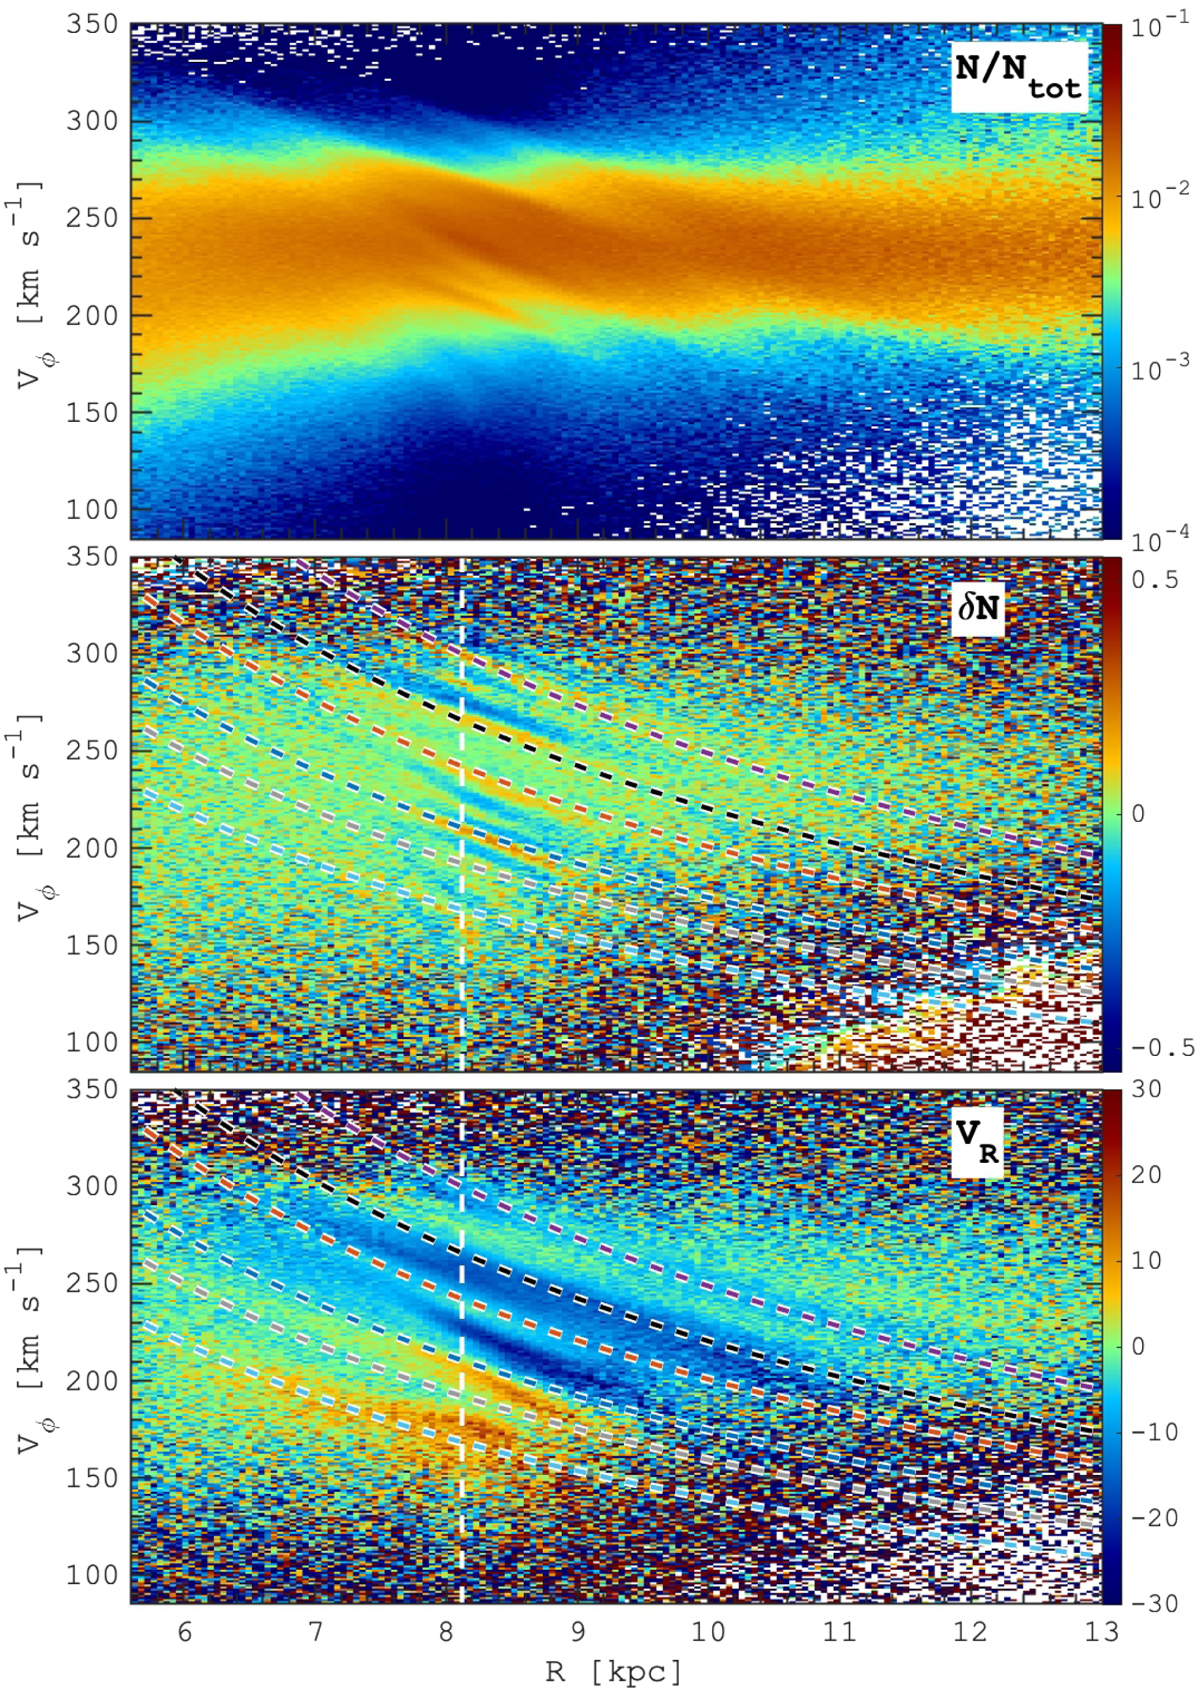
Azimuthal velocity component structure in a narrow region ±5° along the Galactic radius. Top panel: the density of stars normalised at each galactocentric distance. Middle panel: unsharp masking of the density distribution. Bottom panel: same distribution, but colour-coded by the mean radial velocity. Coloured diagonal lines depict the angular momentum selections in a given azimuthal range, using (Xg,Yg) coordinates to identify the overdensities in Khoperskov et al. (2020a) (see also Fig. 5).
Current usage metrics show cumulative count of Article Views (full-text article views including HTML views, PDF and ePub downloads, according to the available data) and Abstracts Views on Vision4Press platform.
Data correspond to usage on the plateform after 2015. The current usage metrics is available 48-96 hours after online publication and is updated daily on week days.
Initial download of the metrics may take a while.