Fig. 6.
Download original image
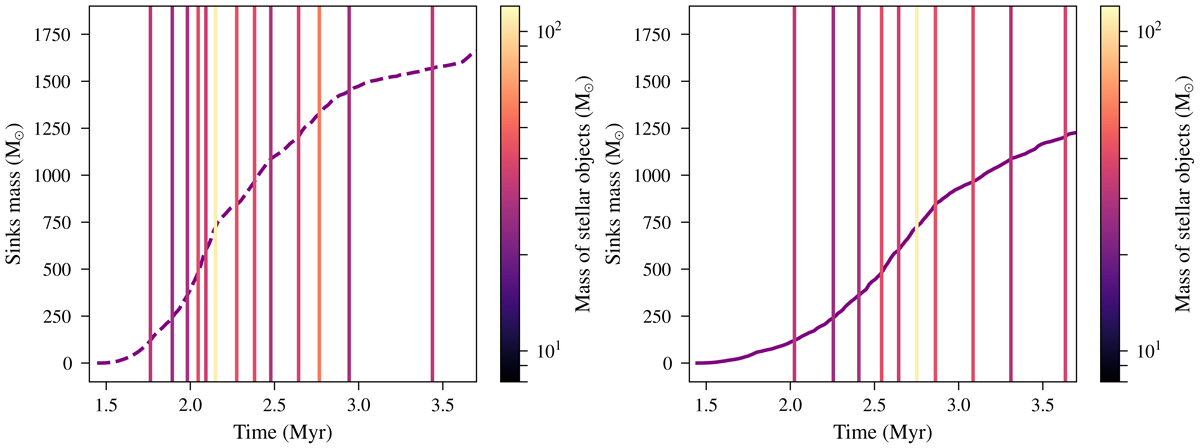
Total mass of sink particles. Left: simulation including only HII regions. Right: simulation including HII regions and protostellar jets. The purple curves in the two panels thus correspond to the same ones as Fig. 4. In the two panels, the vertical lines show the moments of creation of stellar objects, with the colours of the lines coding their mass.
Current usage metrics show cumulative count of Article Views (full-text article views including HTML views, PDF and ePub downloads, according to the available data) and Abstracts Views on Vision4Press platform.
Data correspond to usage on the plateform after 2015. The current usage metrics is available 48-96 hours after online publication and is updated daily on week days.
Initial download of the metrics may take a while.