Fig. 3.
Download original image
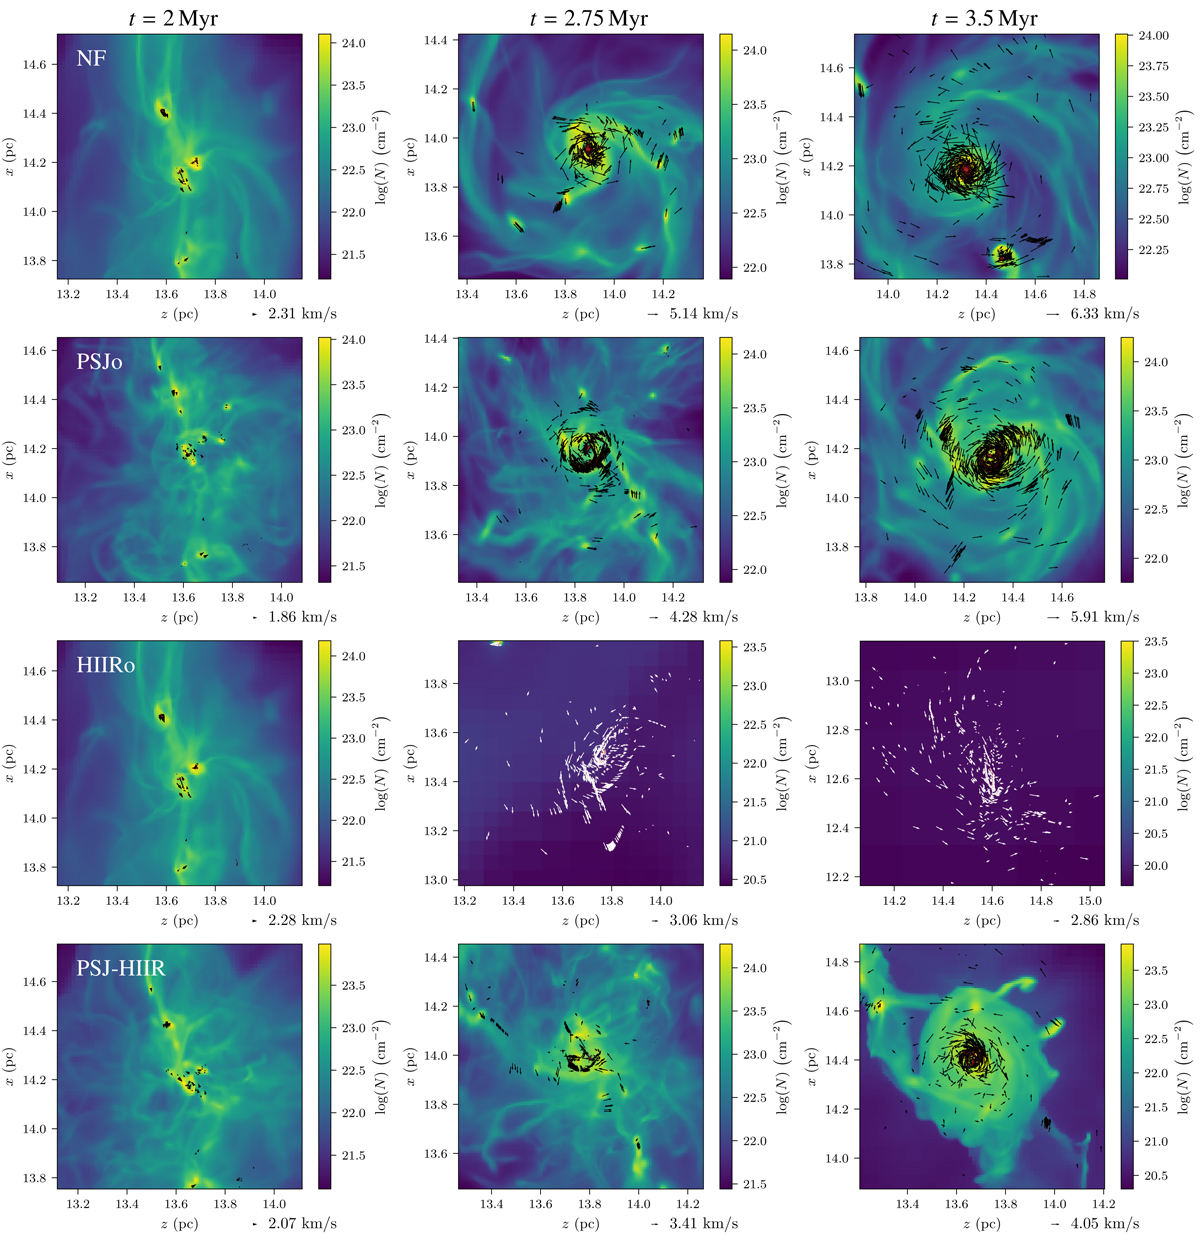
Evolutionary sequence of global appearance of the star cluster. Each row corresponds to a different simulation. The four simulations are visualised at three different times: 2 Myr, 2.75 Myr, and 3.5 Myr. From top to bottom: the simulations without feedback, with protostellar jets only, with HII regions only, and with both jets and HII regions, seen from the y axis of the simulation. The colour scales are not common and depend on each map. The overplotted red circles represent the sink particles and the associated arrows represent their velocities in the plane of the visualisation.
Current usage metrics show cumulative count of Article Views (full-text article views including HTML views, PDF and ePub downloads, according to the available data) and Abstracts Views on Vision4Press platform.
Data correspond to usage on the plateform after 2015. The current usage metrics is available 48-96 hours after online publication and is updated daily on week days.
Initial download of the metrics may take a while.