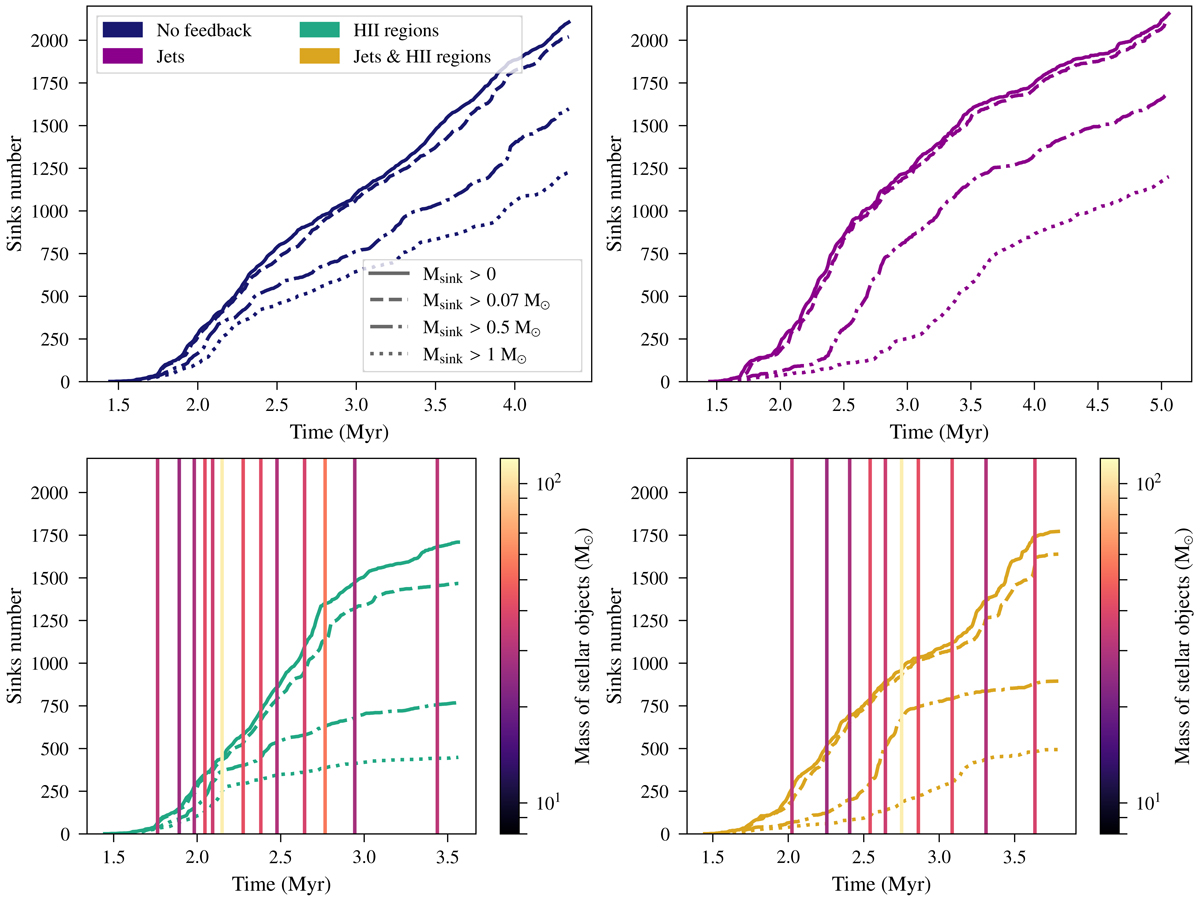
Fig. B.1.
Download original image
Evolution of number of sinks during the temporal evolution. From top to bottom and from left to right: the NF, PSJo, HIIRo, and PSJ-HIIR simulations. For the simulations with HII regions, vertical lines indicate the formation of stellar objects, with colour-coding according to their mass. In the four panels, the solid lines indicate the total number of sinks, the other types of line (dashed, dash-dotted, and dotted, respectively) indicate the number of sinks with a mass lower than a given threshold (0.07, 0.5, and 1 M⊙, respectively).
Current usage metrics show cumulative count of Article Views (full-text article views including HTML views, PDF and ePub downloads, according to the available data) and Abstracts Views on Vision4Press platform.
Data correspond to usage on the plateform after 2015. The current usage metrics is available 48-96 hours after online publication and is updated daily on week days.
Initial download of the metrics may take a while.