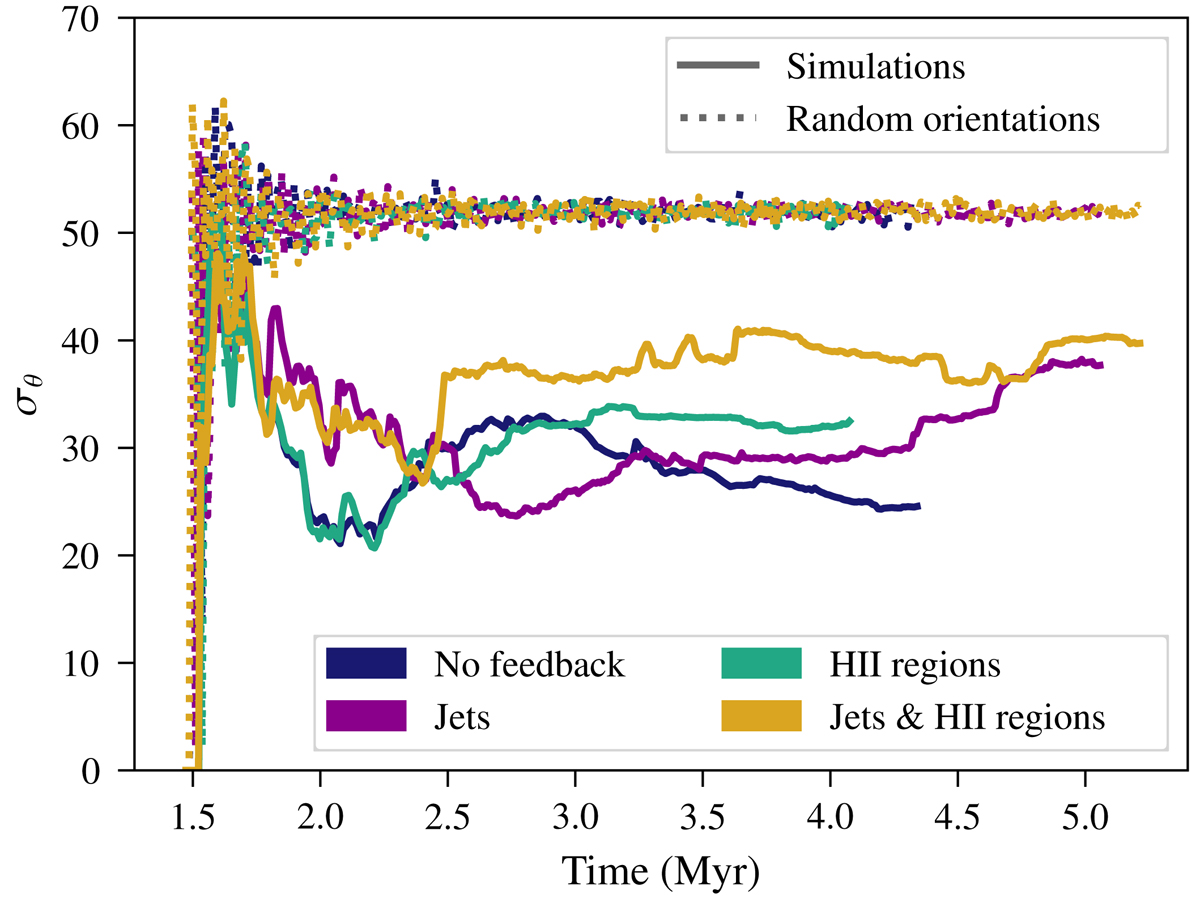
Fig. 13.

Download original image
Solid lines show angular dispersion of the sink particles relatively to the mean angular direction, with each colour corresponding to a different simulation. To only consider relevant sink particles, we selected the ones with masses over 0.07 M⊙. In comparison, the dotted lines show the angular dispersion of a set with the same cardinality as the set of sink particles at each time step, exhibiting random angular orientations. For times longer than 2 Myr, the angular dispersion in the simulations is significantly lower than for a set of random orientations, implying that the sink particles have a preferred angular direction.
Current usage metrics show cumulative count of Article Views (full-text article views including HTML views, PDF and ePub downloads, according to the available data) and Abstracts Views on Vision4Press platform.
Data correspond to usage on the plateform after 2015. The current usage metrics is available 48-96 hours after online publication and is updated daily on week days.
Initial download of the metrics may take a while.


