Fig. 1.
Download original image
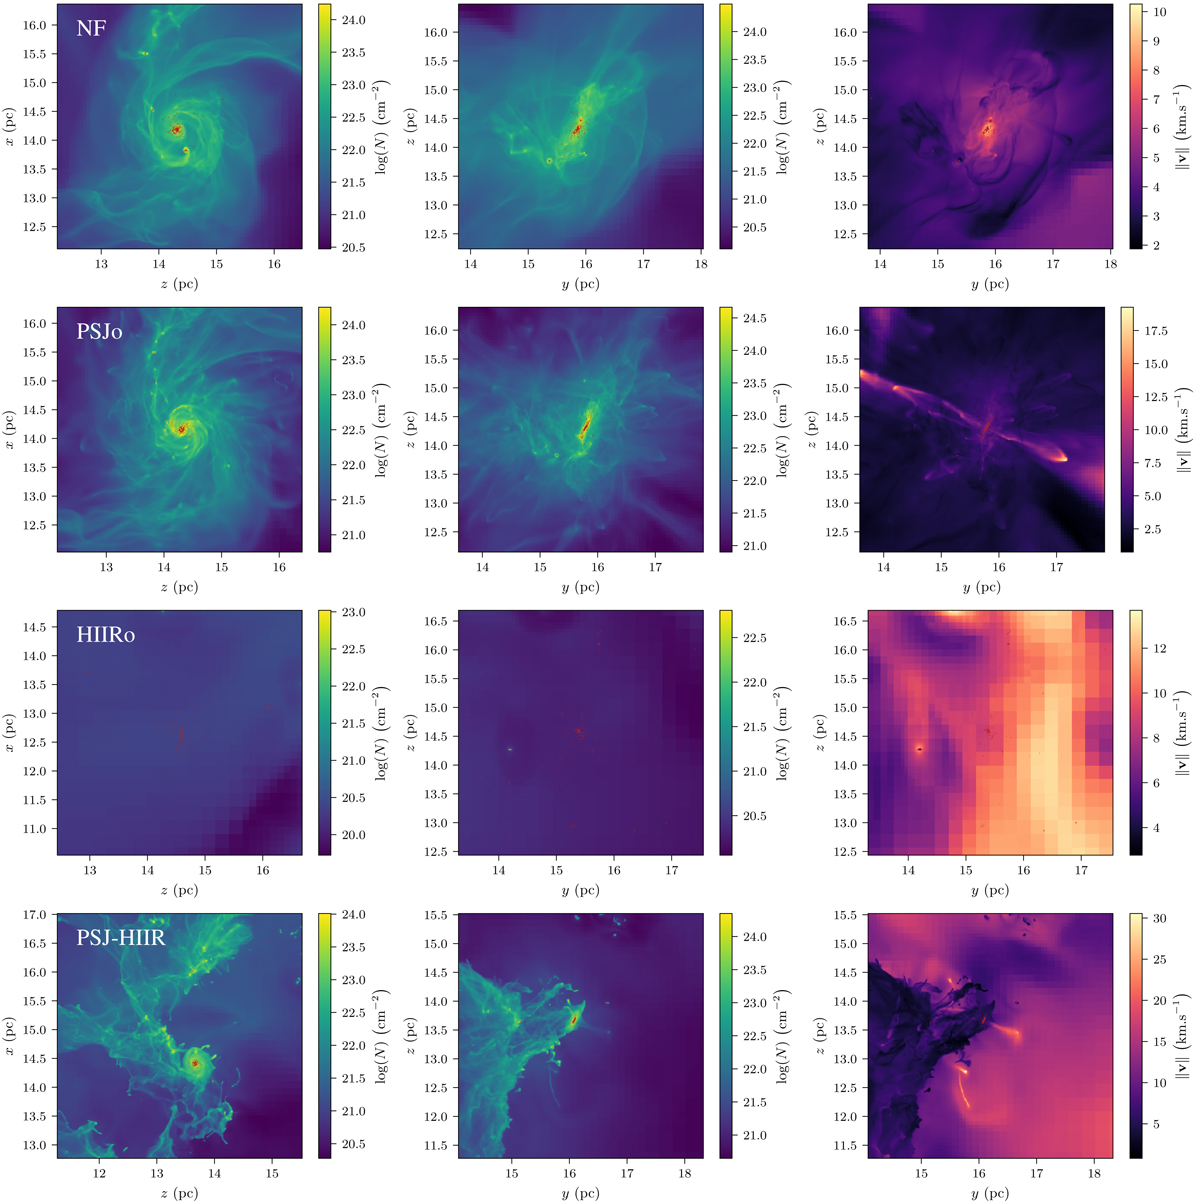
Global appearance of star cluster surrounded by its gas environment. Each row corresponds to a different simulation. The four simulations are visualised at the same time: 3.5 Myr. From top to bottom: are the simulations without feedback, with protostellar jets only, with HII regions only, and with both jets and HII regions. Two first columns: represent column density along the y and x axis of the simulation, and the third column shows the mean of the velocity norm integrated along the line of sight, weighted by the density. The colour scales are not common and depend on each map. The overplotted red circles represent the sink particles. As the view on the two last rows, which corresponds to the simulations with HII regions, is a bit narrow, we presented the same maps with a spatial scale four times larger in Fig. 2. We also present zoomed-in views of the central star cluster in Fig. 3.
Current usage metrics show cumulative count of Article Views (full-text article views including HTML views, PDF and ePub downloads, according to the available data) and Abstracts Views on Vision4Press platform.
Data correspond to usage on the plateform after 2015. The current usage metrics is available 48-96 hours after online publication and is updated daily on week days.
Initial download of the metrics may take a while.