Fig. 9
Download original image
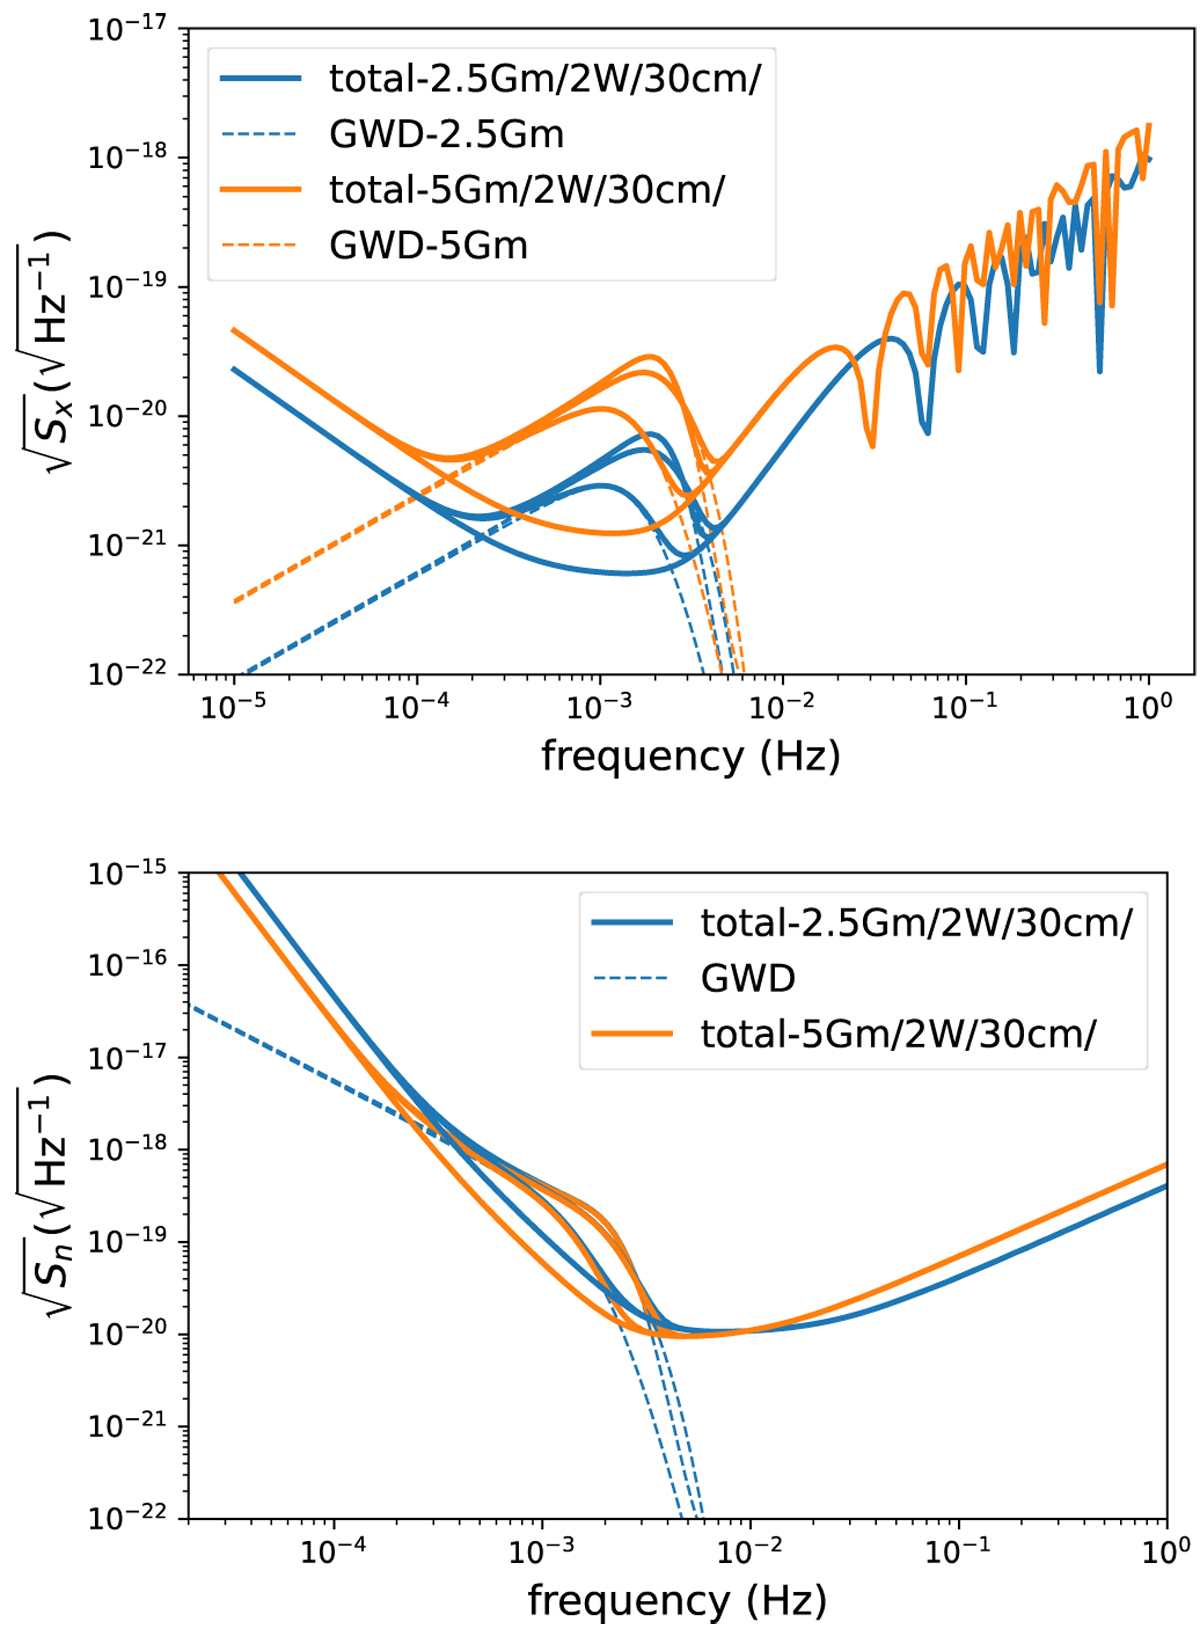
Upper panel: square root of the PSD noise TDI-X corresponding to different LISA configurations. The solid curves are the total PSD, while the dashed curves are the contribution from the confusion GWDs. The bundle of curves in the same colour corresponds to Tobs = 1, 2, 4, and 5 yr from top to bottom; Lower panel: sensitivity curves corresponding to different arm lengths and Tobs. The solid curves are the total curve, while the dashed curves are the contribution from the confusion GWDs. The bundle of curves in the same colour corresponds to Tobs = 1, 2, 4, and 5 yr from top to bottom.
Current usage metrics show cumulative count of Article Views (full-text article views including HTML views, PDF and ePub downloads, according to the available data) and Abstracts Views on Vision4Press platform.
Data correspond to usage on the plateform after 2015. The current usage metrics is available 48-96 hours after online publication and is updated daily on week days.
Initial download of the metrics may take a while.