Free Access
Fig. 25
Download original image
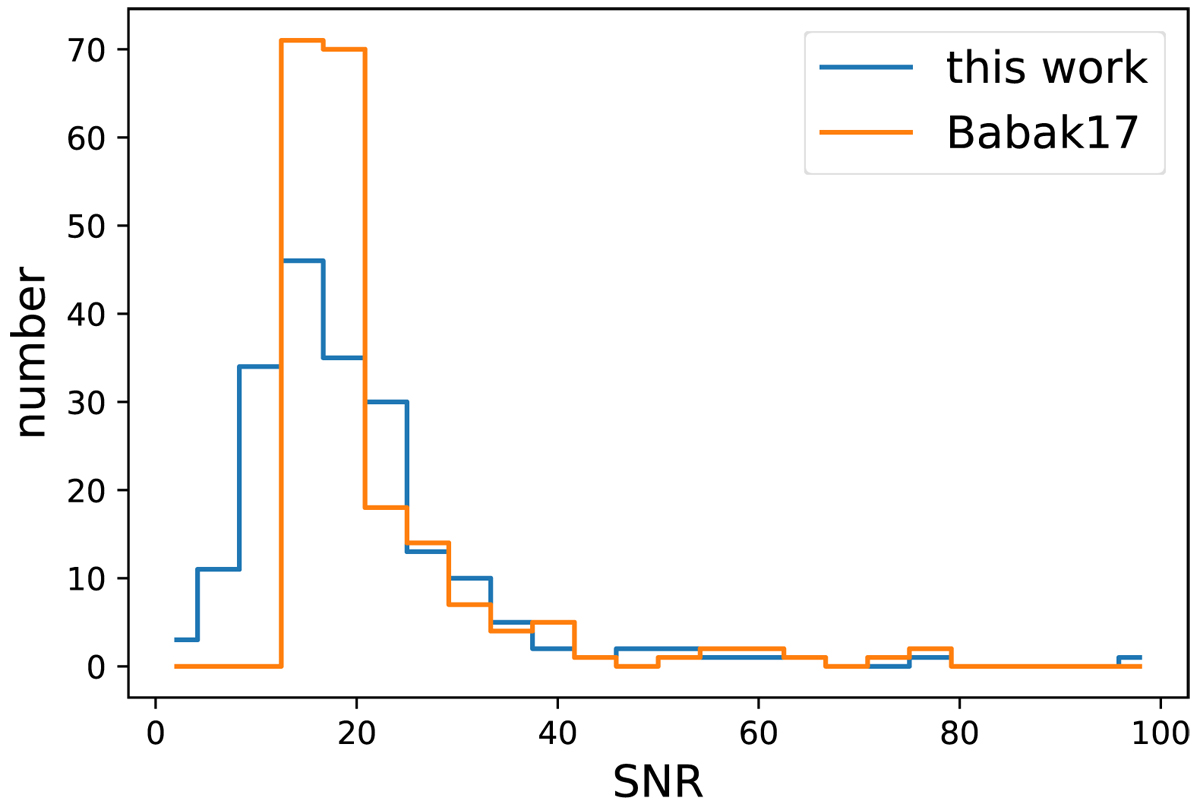
Histogram of the SNR of the bright EMRIs in catalogue of BabaklX The blue histogram indicate the SNR calculated in this work, and the orange histogram is that pre-calculated by Babak17 using a slightly different LISA noise and waveform.
Current usage metrics show cumulative count of Article Views (full-text article views including HTML views, PDF and ePub downloads, according to the available data) and Abstracts Views on Vision4Press platform.
Data correspond to usage on the plateform after 2015. The current usage metrics is available 48-96 hours after online publication and is updated daily on week days.
Initial download of the metrics may take a while.