Free Access
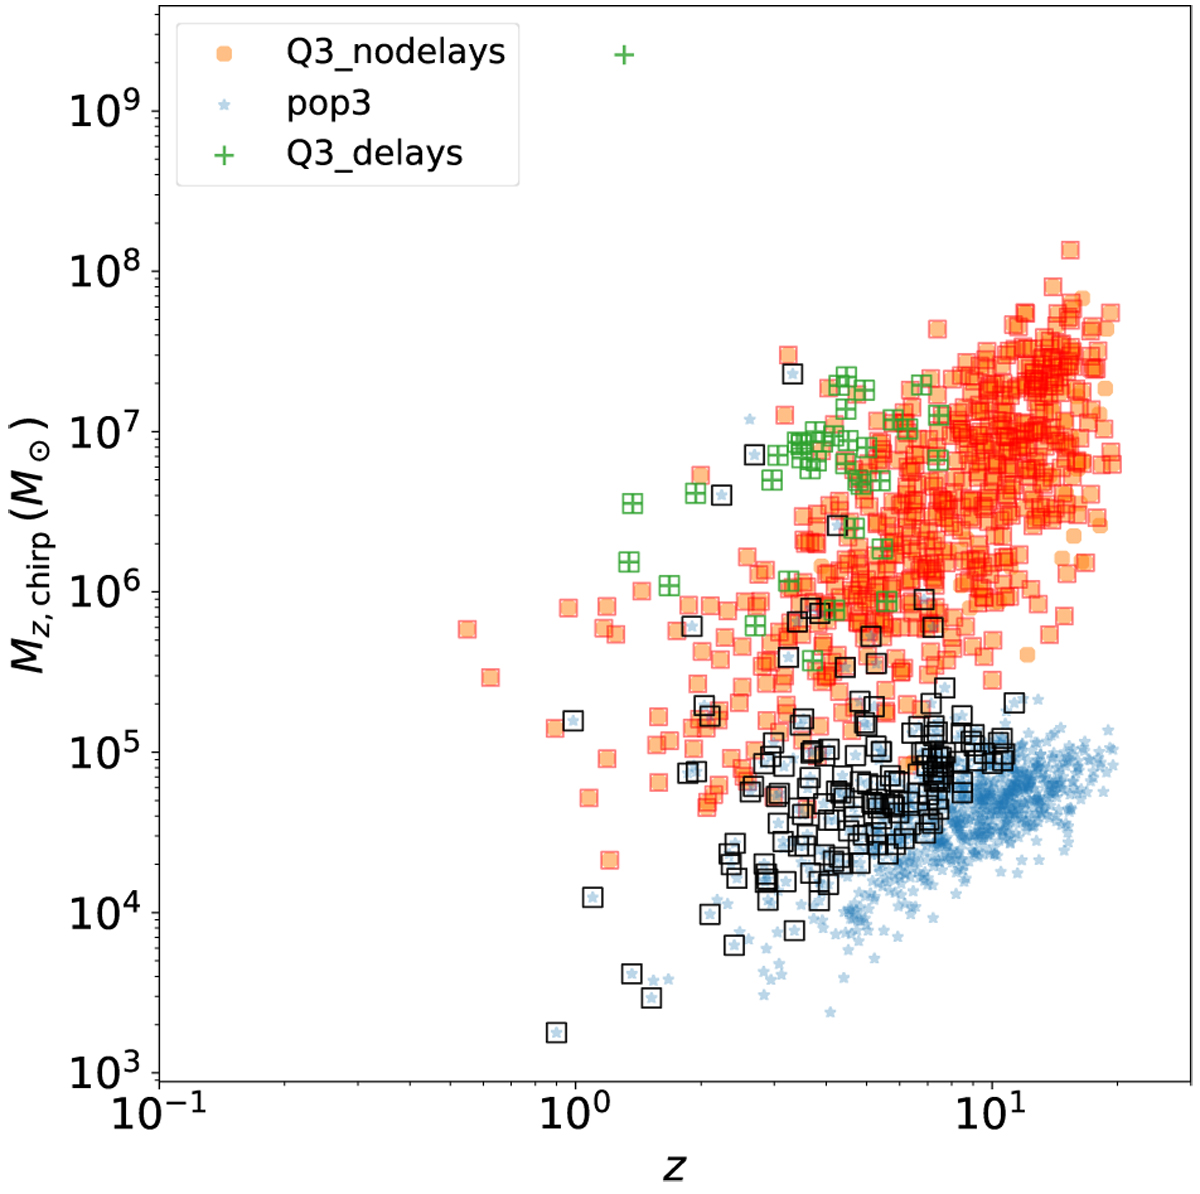
Fig. 21
Download original image
Redshifted chirp masses and the redshift of the total events (markers) and detected ones (squares on top of markers) by the standard LISA configuration in 5 yr. Orange, blue, and green markers correspond to Q3_nodelay, рорЗ, and Q3_delays population models, respectively. The underlying S/N cutoff is 8.
Current usage metrics show cumulative count of Article Views (full-text article views including HTML views, PDF and ePub downloads, according to the available data) and Abstracts Views on Vision4Press platform.
Data correspond to usage on the plateform after 2015. The current usage metrics is available 48-96 hours after online publication and is updated daily on week days.
Initial download of the metrics may take a while.