Fig. 16
Download original image
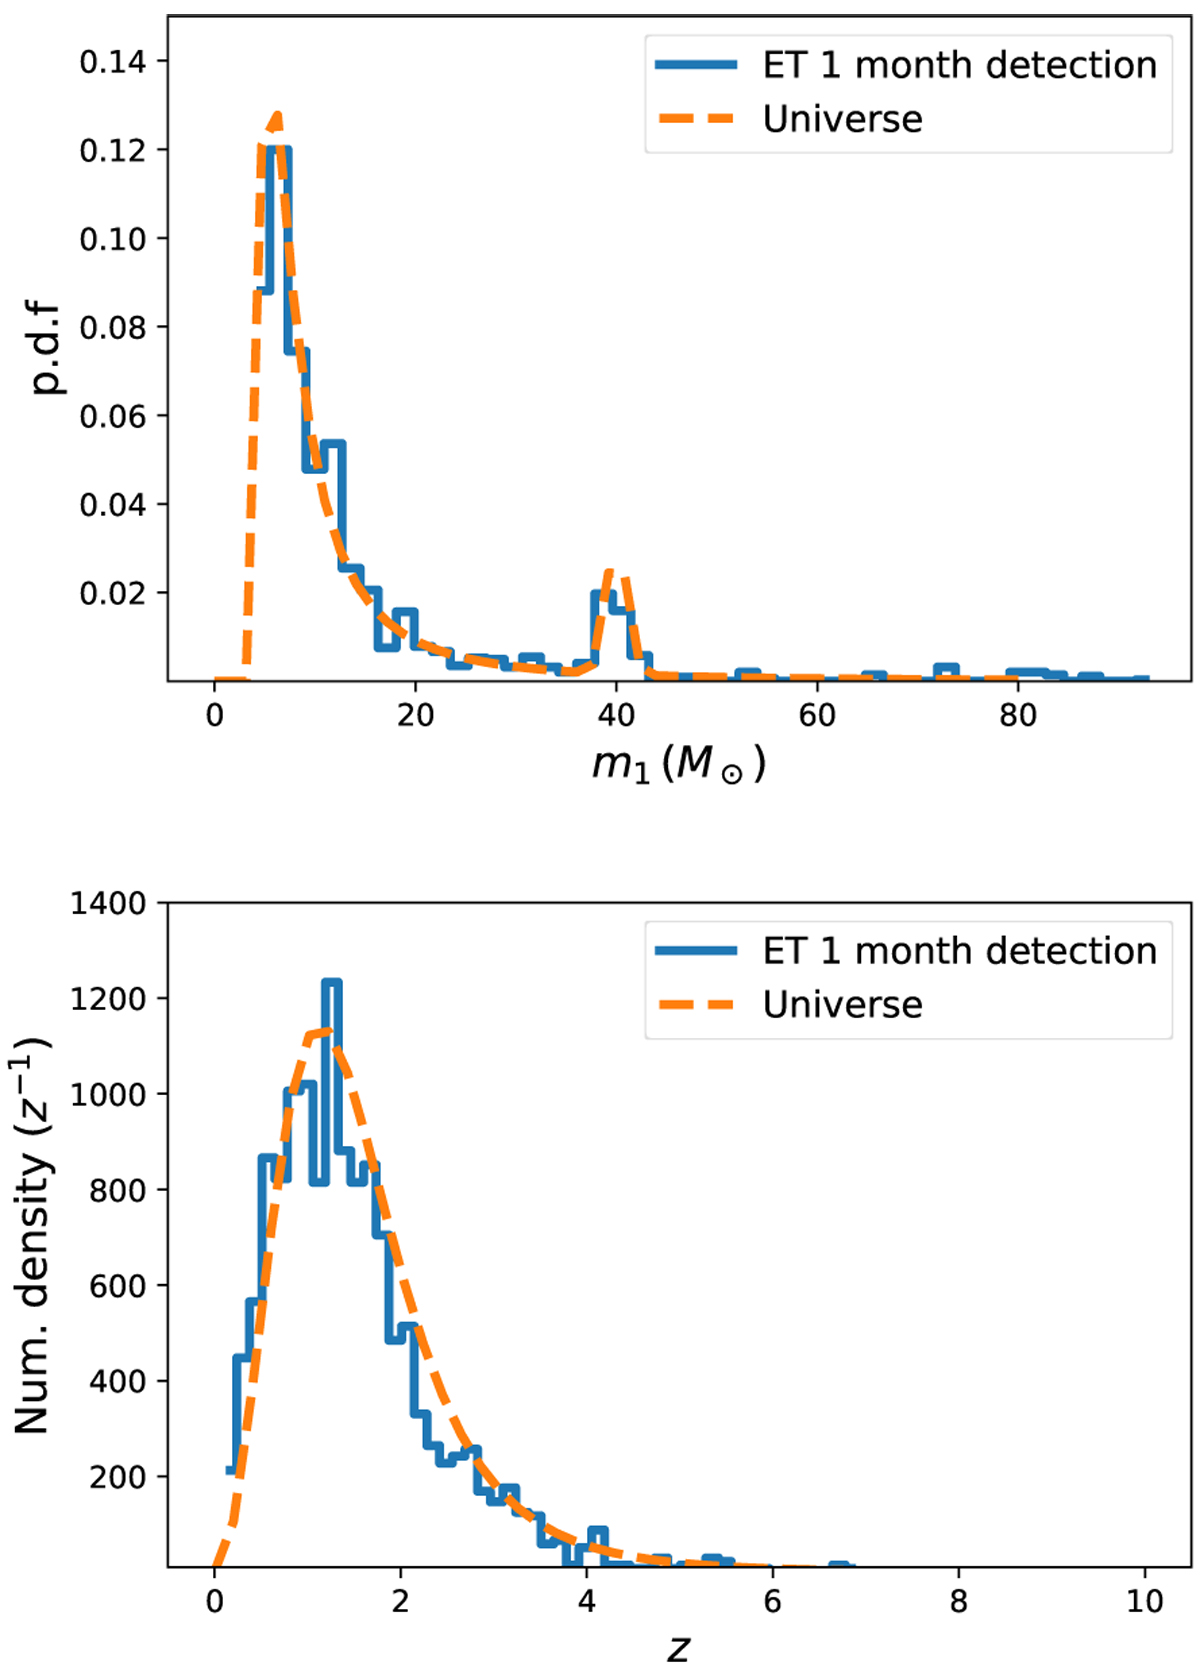
m1 distribution (upper panel) and the number density as function of redshift (lowerpanel) in the catalogue for 1 month of observation of BBH mergers by ET (solid blue line). The integral of the latter is the total number of detections. As a comparison, we plot the distribution of BBH mergers for the whole Universe within 1 month (dashed orange line).
Current usage metrics show cumulative count of Article Views (full-text article views including HTML views, PDF and ePub downloads, according to the available data) and Abstracts Views on Vision4Press platform.
Data correspond to usage on the plateform after 2015. The current usage metrics is available 48-96 hours after online publication and is updated daily on week days.
Initial download of the metrics may take a while.