Free Access
Fig. 11
Download original image
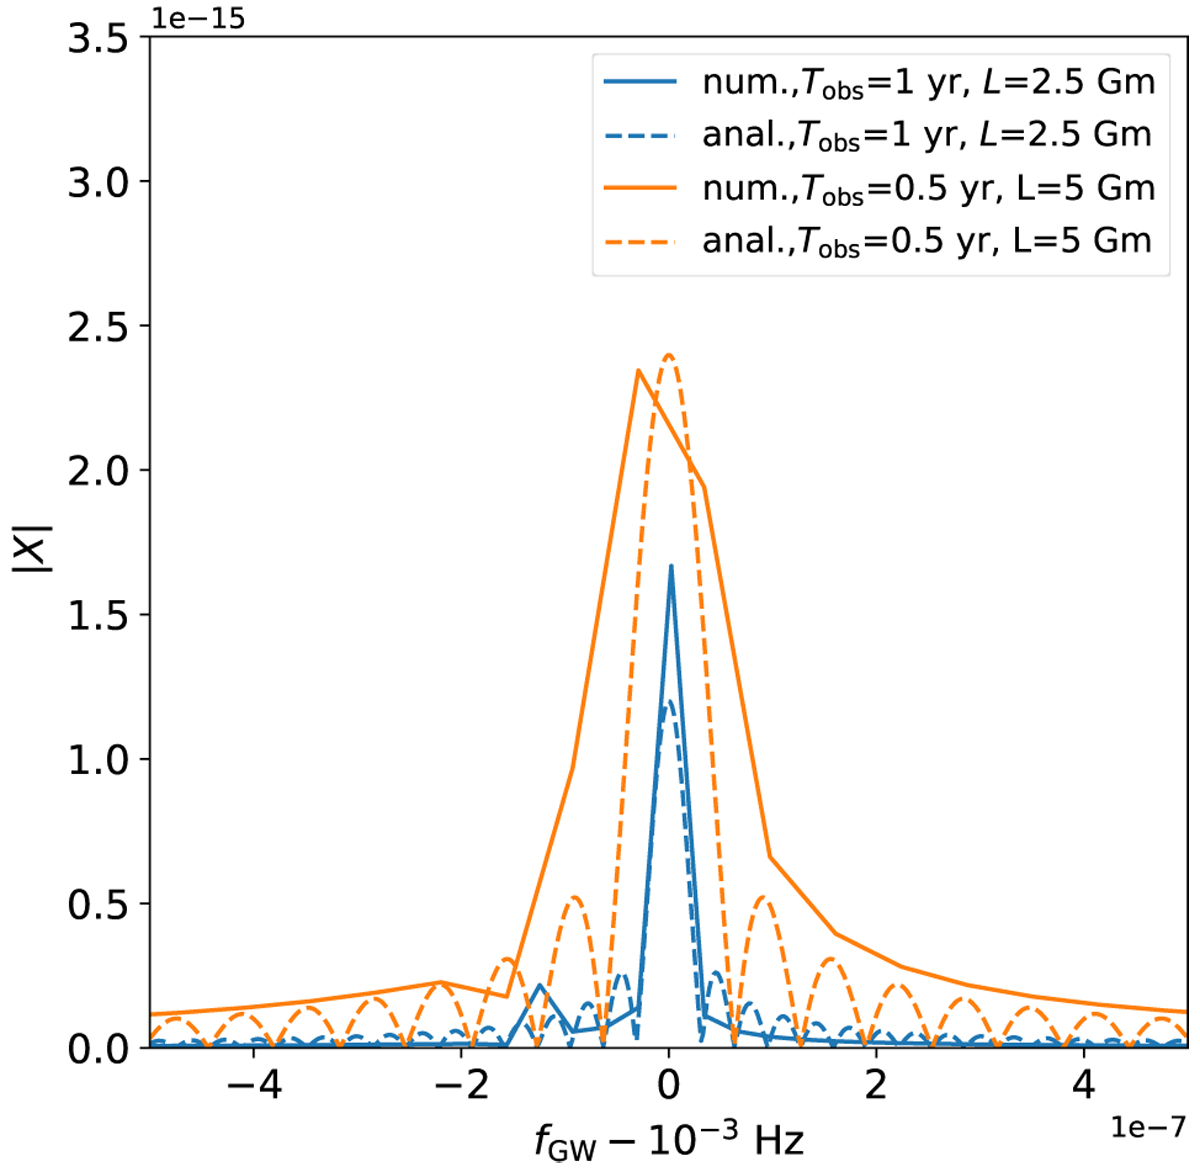
Frequency domain LISA responses to GW from a DWD: The blue and orange lines correspond to two different LISA configurations; solid and dashed lines correspond to responses calculated with numerical and analytical methods respectively.
Current usage metrics show cumulative count of Article Views (full-text article views including HTML views, PDF and ePub downloads, according to the available data) and Abstracts Views on Vision4Press platform.
Data correspond to usage on the plateform after 2015. The current usage metrics is available 48-96 hours after online publication and is updated daily on week days.
Initial download of the metrics may take a while.