Free Access
Fig. 7
Download original image
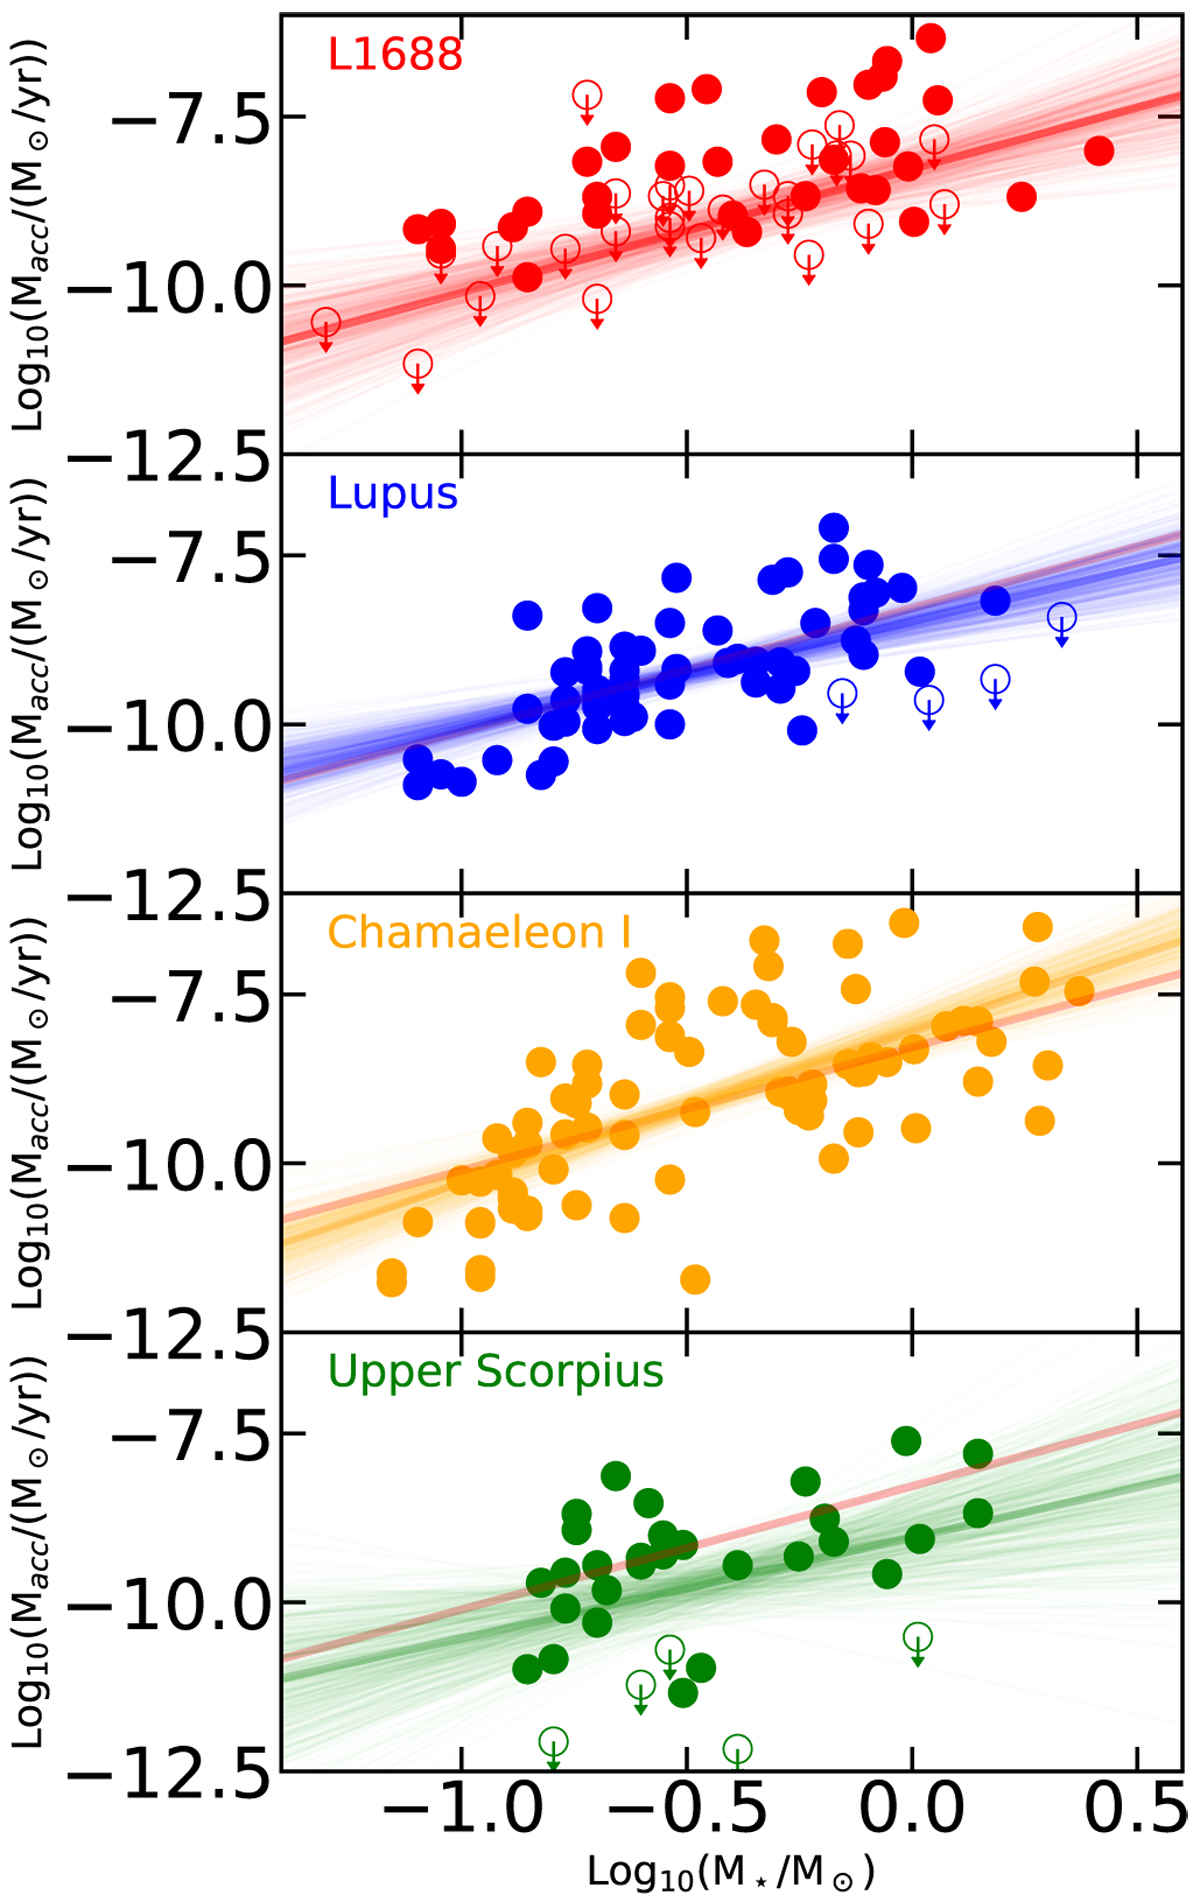
Mass accretion rate as a function of M⋆ for the four regions for which Ṁacc is known, as labeled. In each panel we show the result of a linear fit performed including the whole range of M⋆ as discussed in the text. The orange line shows the best fit for L1688.
Current usage metrics show cumulative count of Article Views (full-text article views including HTML views, PDF and ePub downloads, according to the available data) and Abstracts Views on Vision4Press platform.
Data correspond to usage on the plateform after 2015. The current usage metrics is available 48-96 hours after online publication and is updated daily on week days.
Initial download of the metrics may take a while.