Fig. 4
Download original image
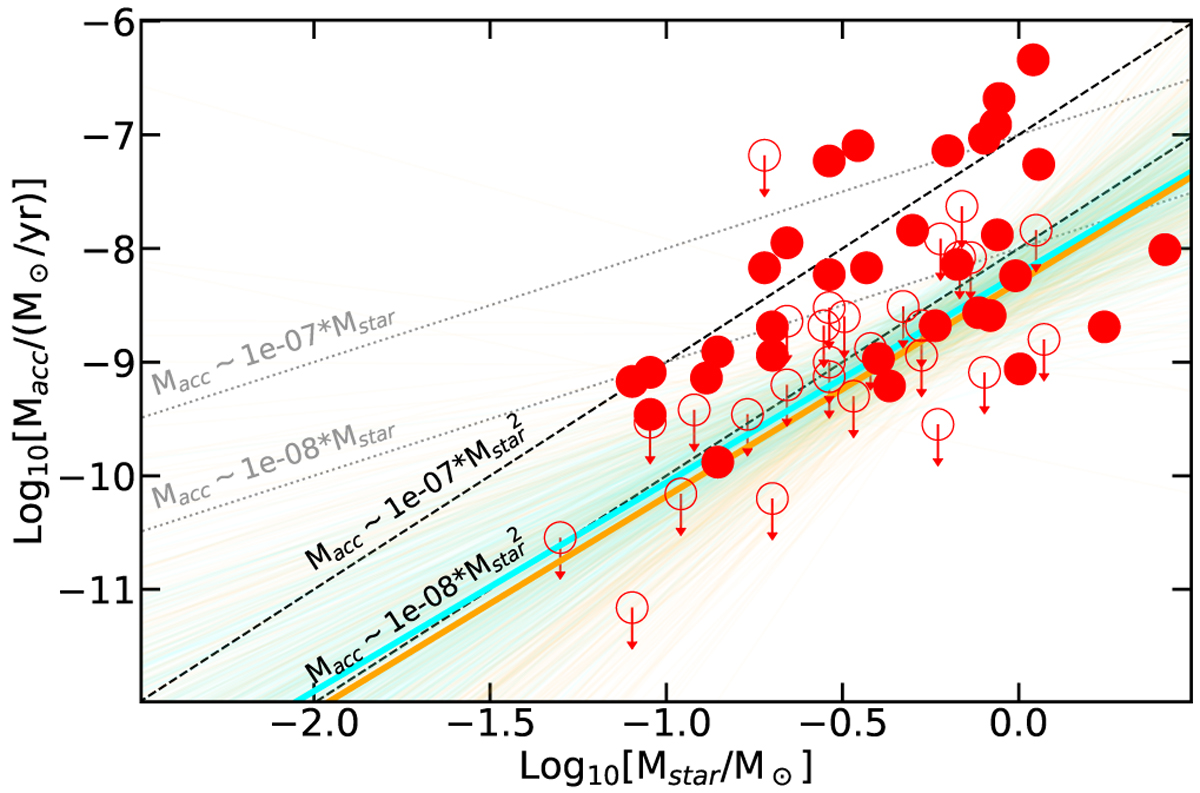
Mass accretion rate as a function of M⋆ for L1688; symbols as in Fig. 3. Cyan lines show the results of a linear fit over the whole range of M⋆; orange lines the results when stars with M⋆ < 0.15 M⊙ are excluded (see text). For comparison, we plot the relations Ṁacc ∝ Μ⋆2 (dashed black lines) and Ṁaœ ∝ M⋆(dotted grey lines) for different values of the Ṁacc/M⋆ ratio, as labeled.
Current usage metrics show cumulative count of Article Views (full-text article views including HTML views, PDF and ePub downloads, according to the available data) and Abstracts Views on Vision4Press platform.
Data correspond to usage on the plateform after 2015. The current usage metrics is available 48-96 hours after online publication and is updated daily on week days.
Initial download of the metrics may take a while.