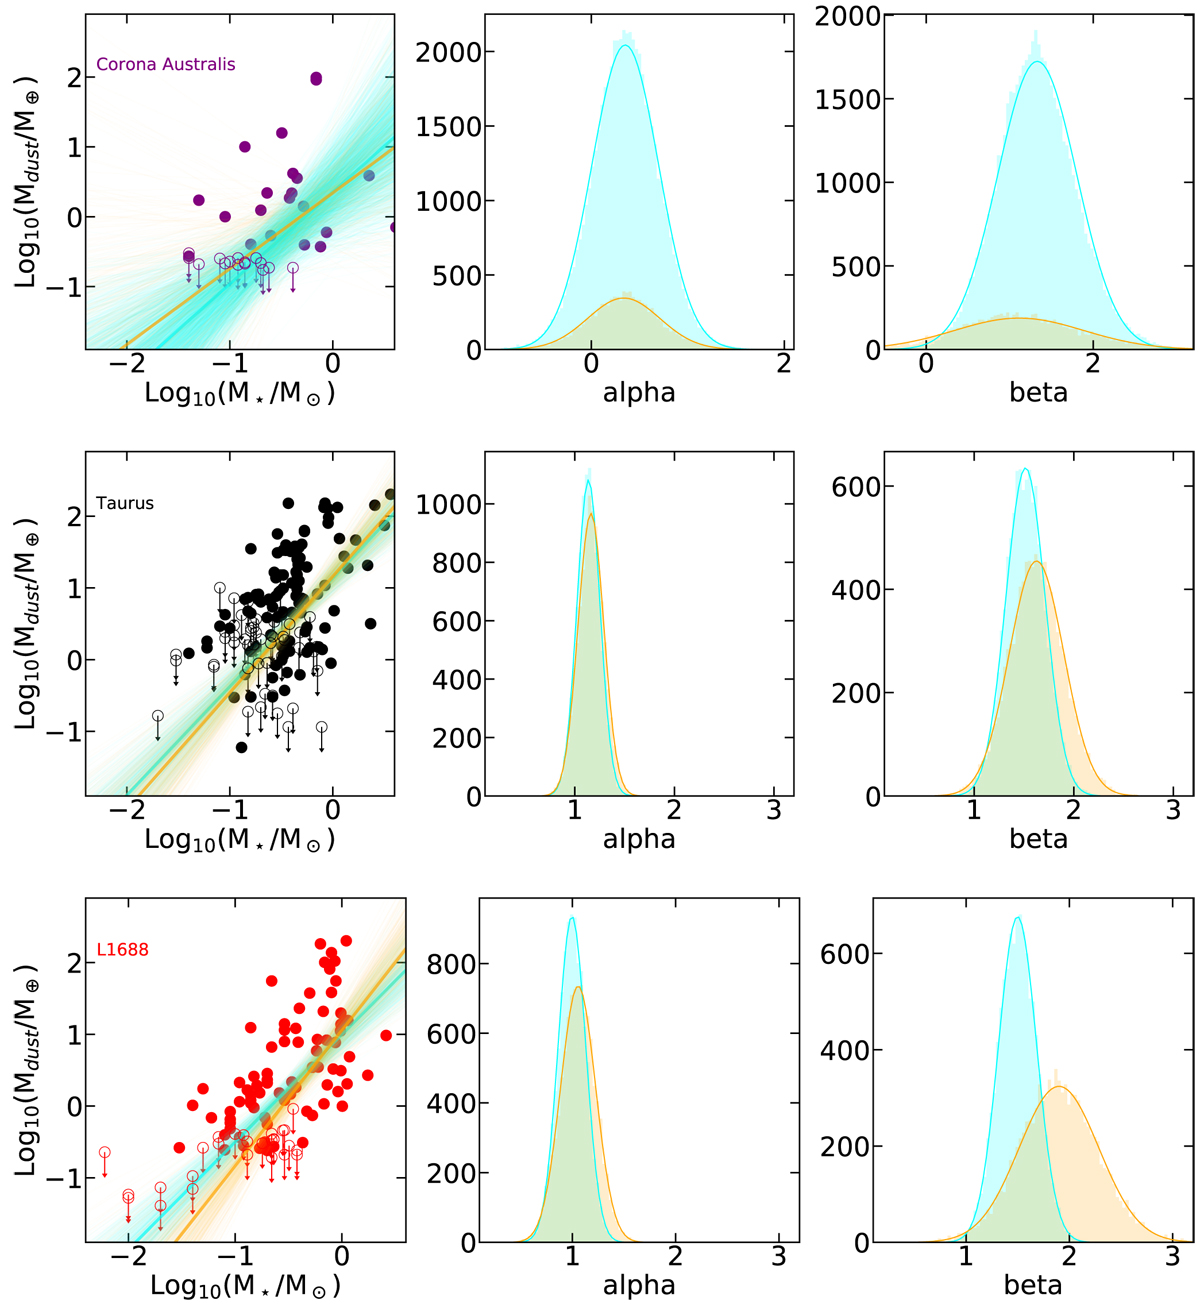
Fig. H.1
Download original image
Power-law fits to the Mdust vs. M⋆ relationships. From top to bottom: Results for Corona Australis, Taurus, and L1688. From left to right: Plot of the dataset and fit results, probability distributions for the a parameter in Eq. H.1, and for the β parameter in Eq. H.1. Cyan is when all objects are included, orange when objects with Μ* < 0.15 M⊙ are excluded.
Current usage metrics show cumulative count of Article Views (full-text article views including HTML views, PDF and ePub downloads, according to the available data) and Abstracts Views on Vision4Press platform.
Data correspond to usage on the plateform after 2015. The current usage metrics is available 48-96 hours after online publication and is updated daily on week days.
Initial download of the metrics may take a while.