Fig. 10
Download original image
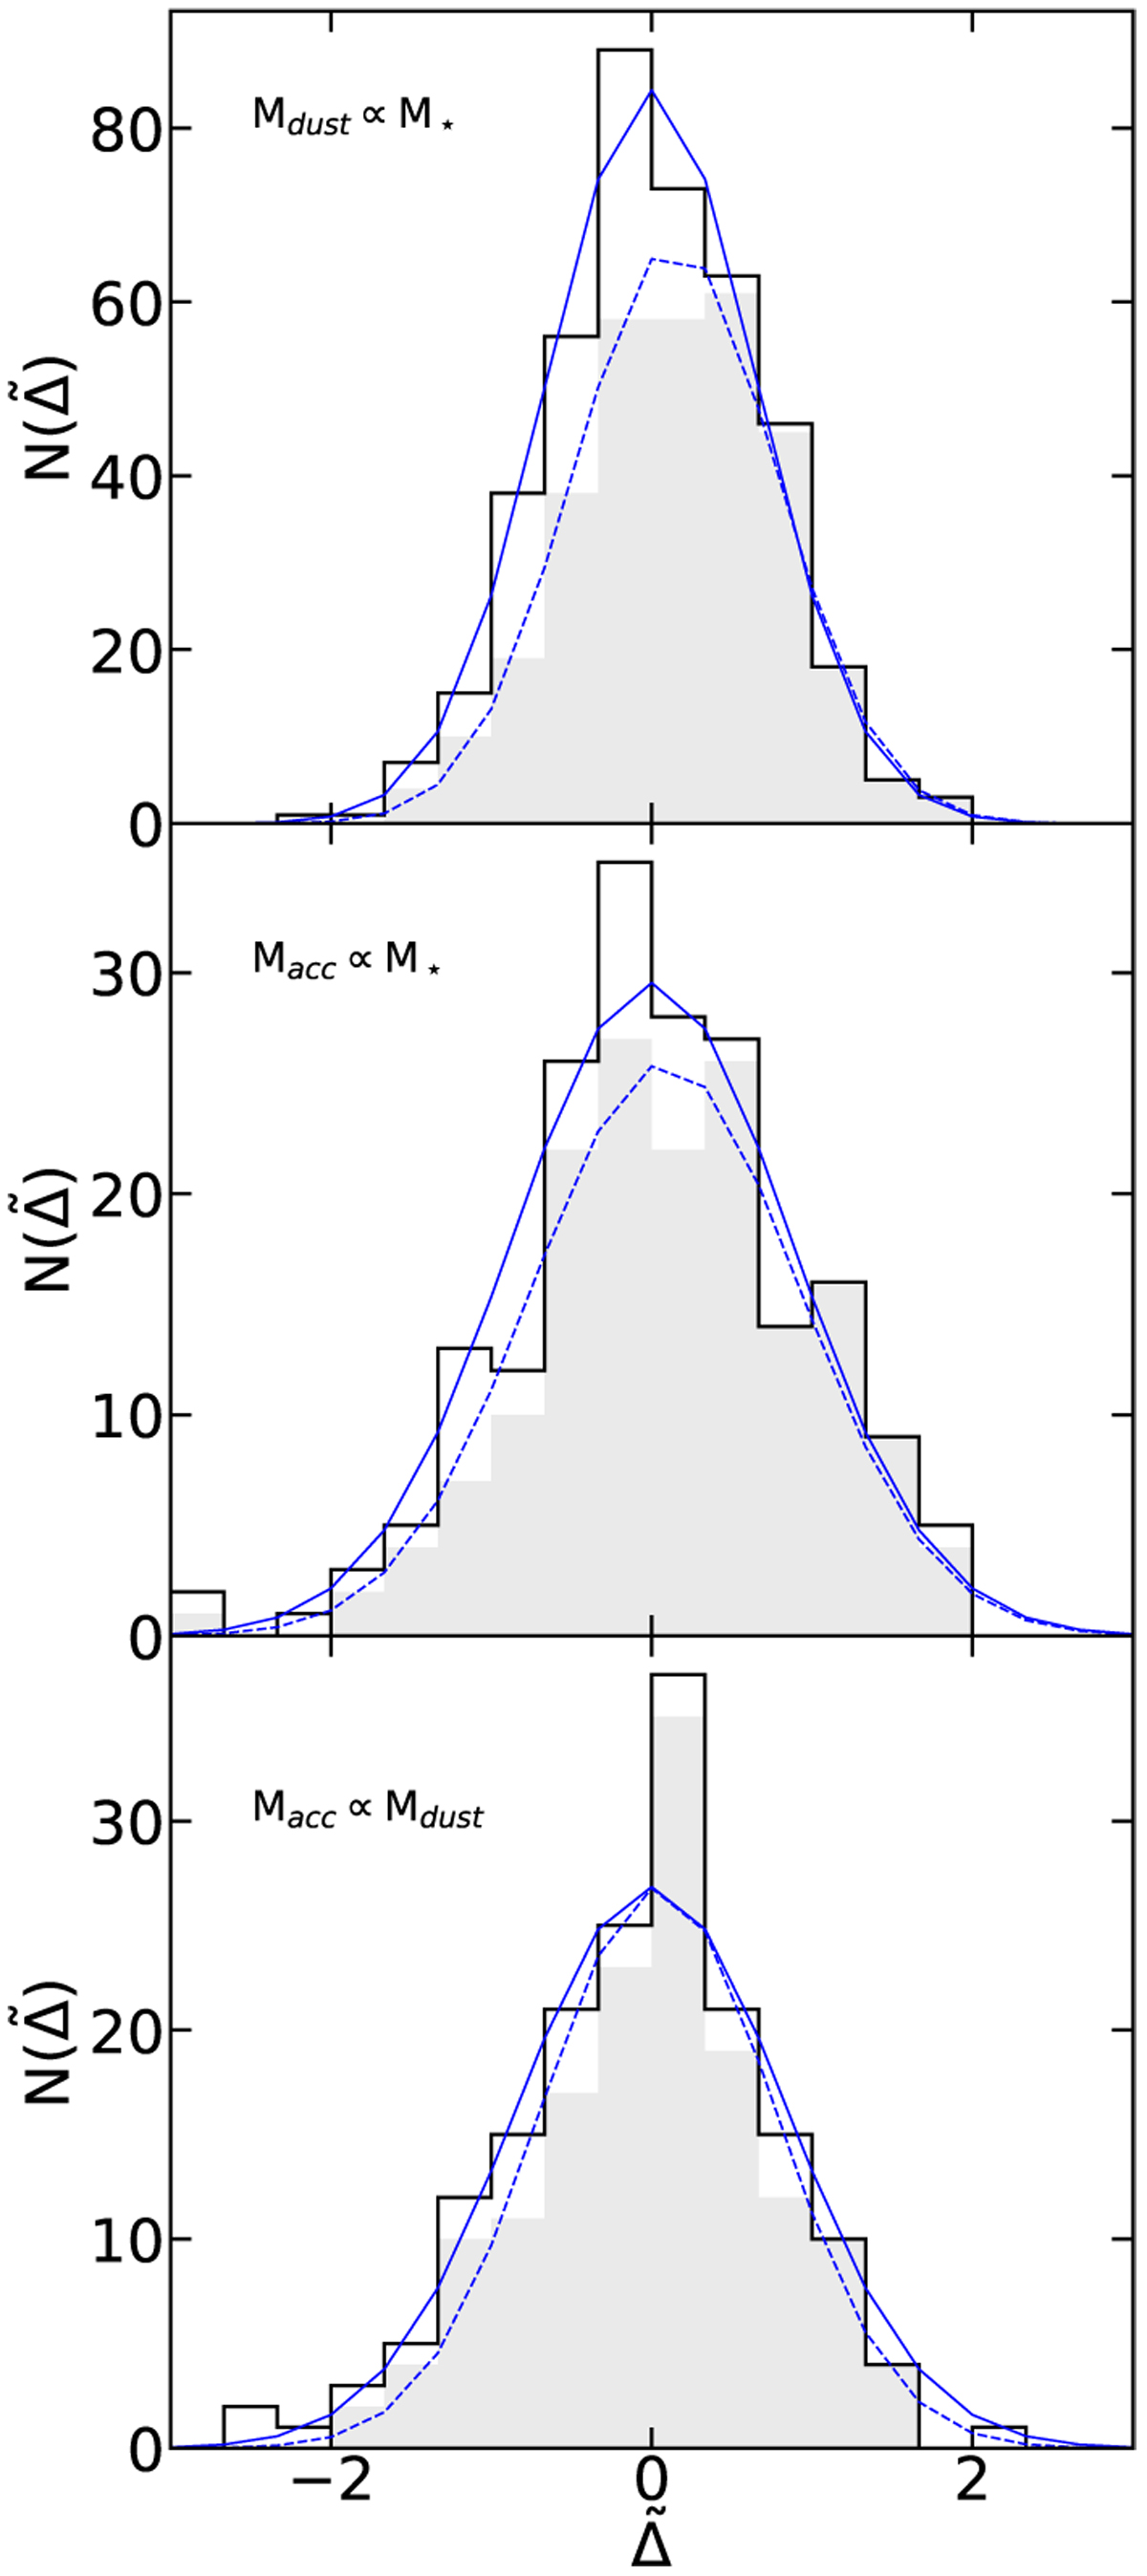
Distribution of the dispersion from the individual best-fitting relations for of all regions combined (see text). The dispersion (in dex units, ![]() ) is computed as the distance of the individual values of Mdust and Maœ from the best-fit relation with M⋆ (top and middle panels) or Mask (bottom panel), we include all objects with Μ⋆ > 0.15 Μ⊙. The solid black lines show the results when upper limits are treated as actual measurements, gray shaded areas show the results when they are excluded. The blue solid and dotted lines show the Gaussian fits to the two distributions.
) is computed as the distance of the individual values of Mdust and Maœ from the best-fit relation with M⋆ (top and middle panels) or Mask (bottom panel), we include all objects with Μ⋆ > 0.15 Μ⊙. The solid black lines show the results when upper limits are treated as actual measurements, gray shaded areas show the results when they are excluded. The blue solid and dotted lines show the Gaussian fits to the two distributions.
Current usage metrics show cumulative count of Article Views (full-text article views including HTML views, PDF and ePub downloads, according to the available data) and Abstracts Views on Vision4Press platform.
Data correspond to usage on the plateform after 2015. The current usage metrics is available 48-96 hours after online publication and is updated daily on week days.
Initial download of the metrics may take a while.