Free Access
Fig. 1
Download original image
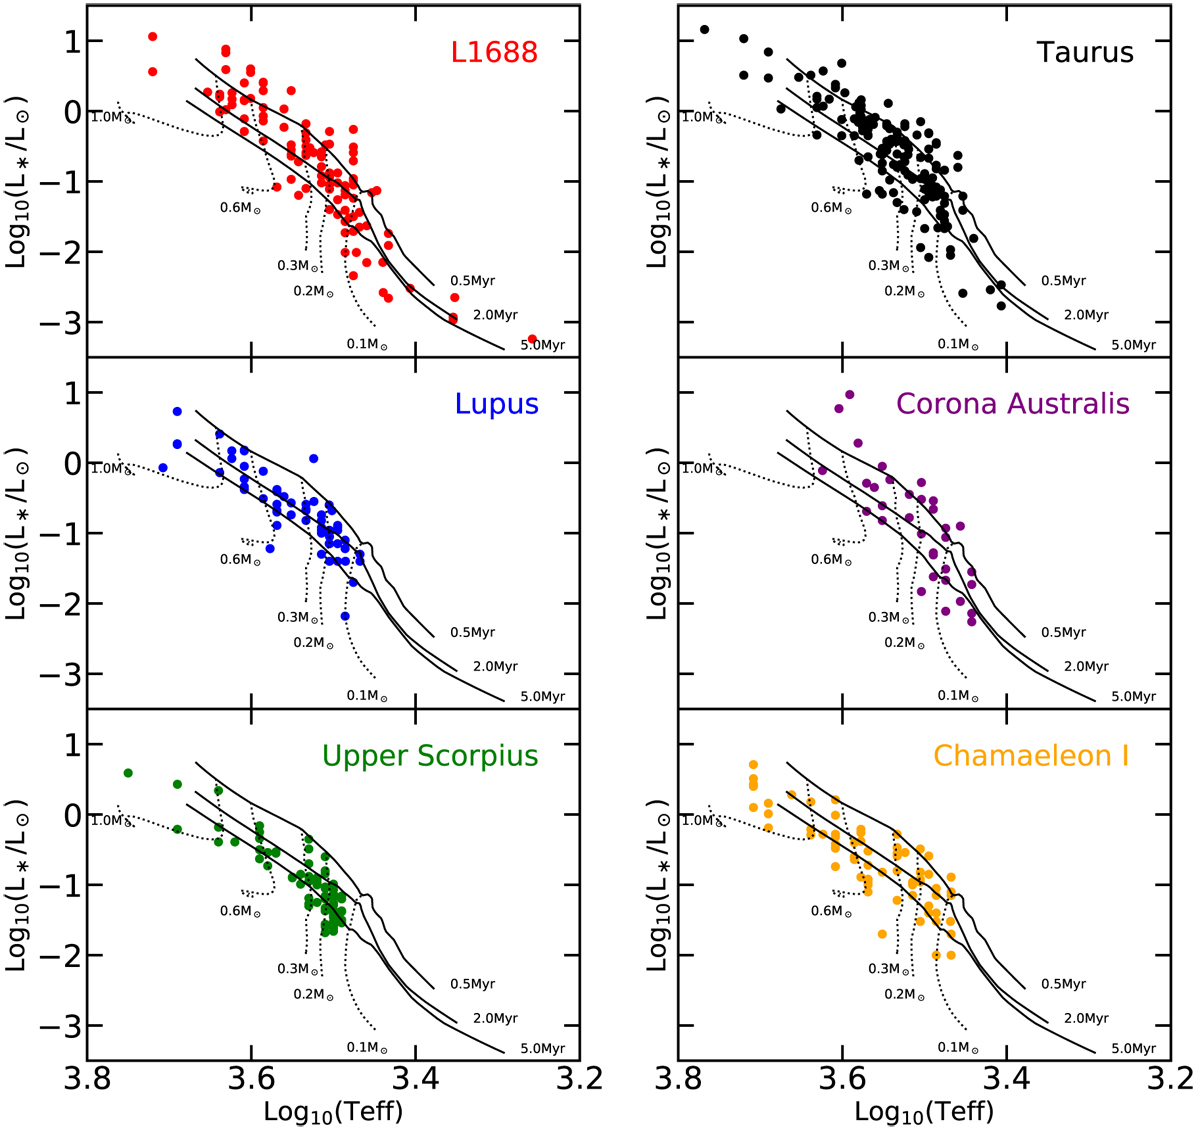
HR diagrams for the six star-forming regions, as labelled in each panel. Stellar evolutionary tracks (dotted lines) and isochrones (solid lines) are from Baraffe et al. (2015); masses and ages are as labelled.
Current usage metrics show cumulative count of Article Views (full-text article views including HTML views, PDF and ePub downloads, according to the available data) and Abstracts Views on Vision4Press platform.
Data correspond to usage on the plateform after 2015. The current usage metrics is available 48-96 hours after online publication and is updated daily on week days.
Initial download of the metrics may take a while.