Fig. 1
Download original image
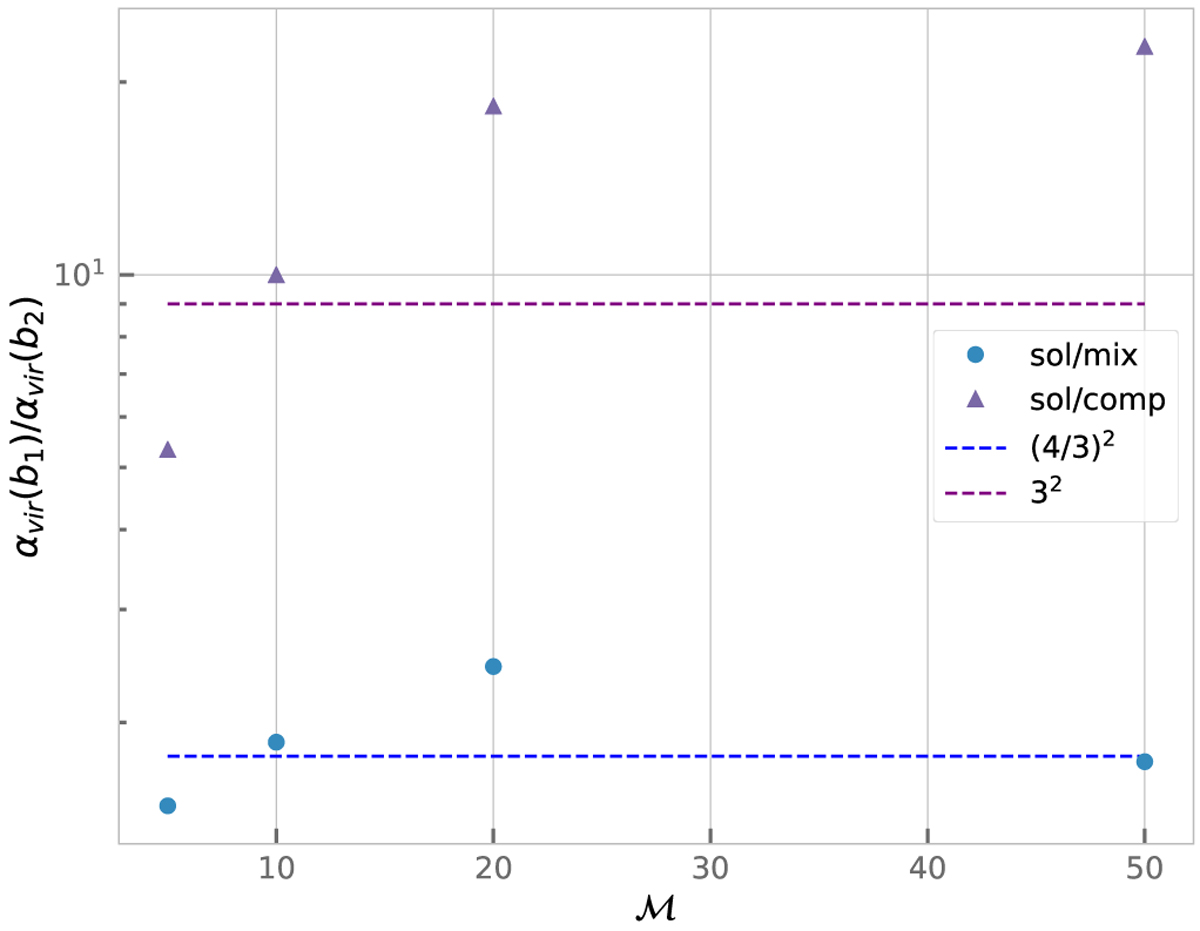
Ratio of virial parameters from the simulations of Federrath & Klessen (2012, Federrath & Klessen 2013) for three different types of forcing. Each point corresponds to a Mach number, ℳ, and size L. Triangles (sol/comp) show the ratio between virial parameters for solenoidal (b ≃ 0.3) and compressive forcing (b ≃ 1) and circles (sol/mix) show the ratio between solenoidal and mixed forcing (b ≃ 0.4). The horizontal dashed lines give the expected value of th e ratios for a scaling in b−2.
Current usage metrics show cumulative count of Article Views (full-text article views including HTML views, PDF and ePub downloads, according to the available data) and Abstracts Views on Vision4Press platform.
Data correspond to usage on the plateform after 2015. The current usage metrics is available 48-96 hours after online publication and is updated daily on week days.
Initial download of the metrics may take a while.